
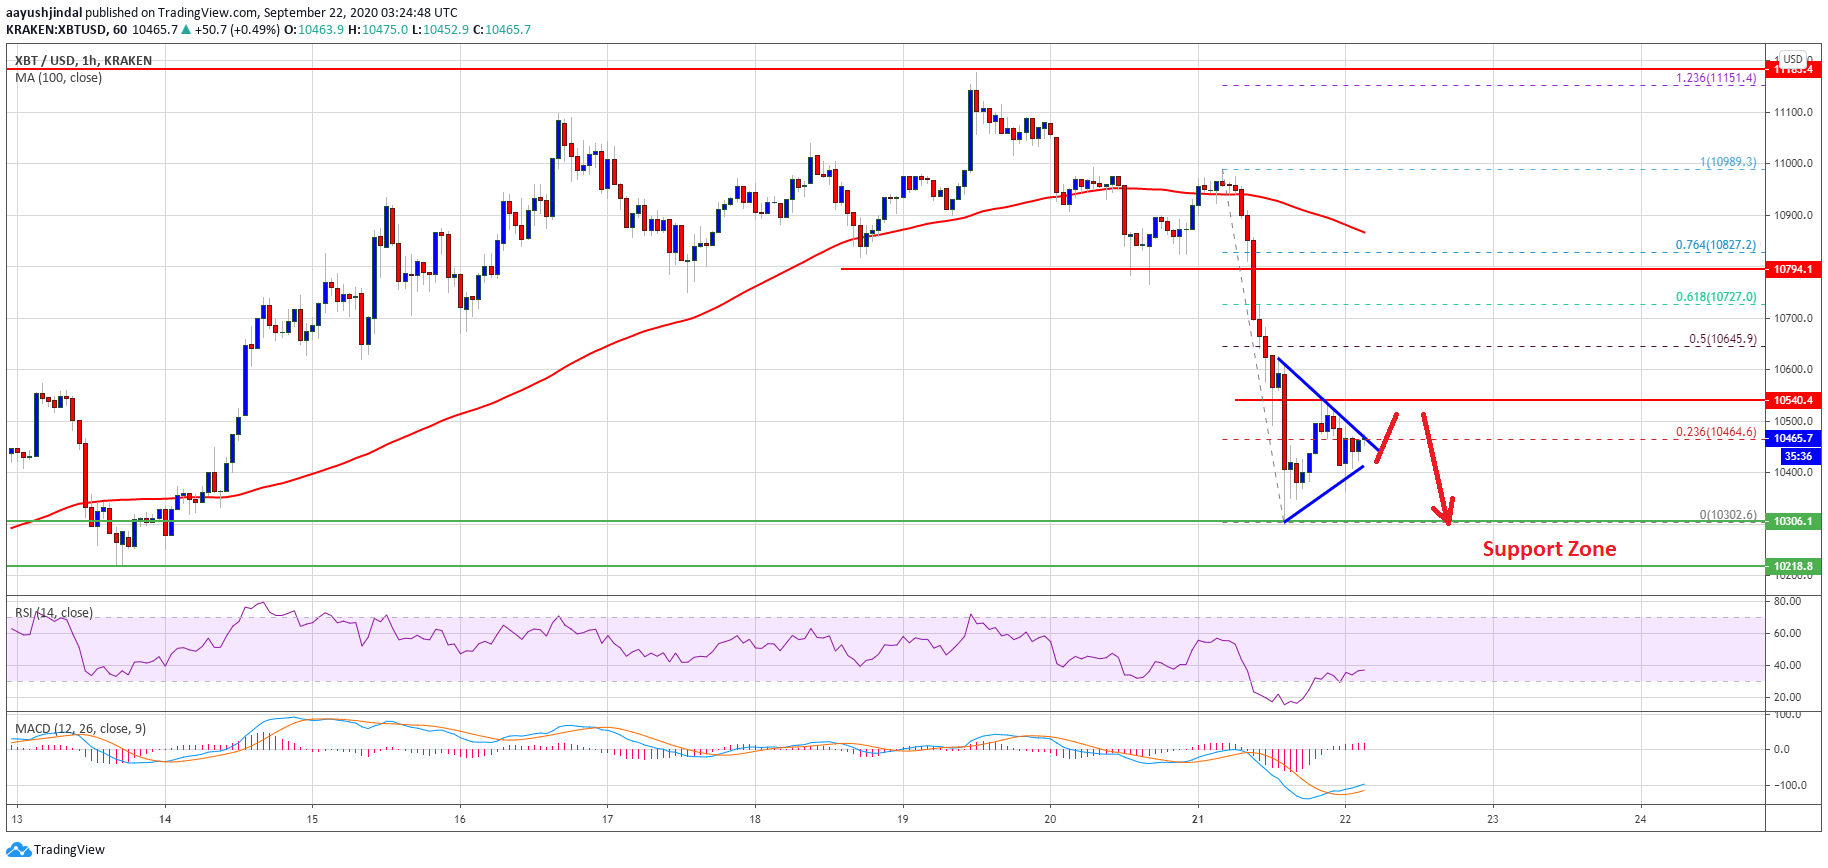
Bitcoin price failed to stay above the $10,750 support and declined sharply against the US Dollar. BTC is holding the $10,200 support, but there is a risk of more downsides.
- Bitcoin is down 5% and it broke the $10,750 and $10,550 support levels.
- The price is holding the $10,300 region, but it is well below the 100 hourly simple moving average.
- There is a major contracting triangle forming with resistance near $10,470 on the hourly chart of the BTC/USD pair (data feed from Kraken).
- The pair could correct higher, but the $10,550 zone is now likely to act as a strong resistance.
Bitcoin Price Dives 5%
After a couple of failed attempts near $11,000, bitcoin price started a fresh decline against the US Dollar. BTC broke the $10,750 support level to start a substantial decline.
There was also a break below the key $10,550 support and the 100 hourly simple moving average. The price traded close to the $10,200 support and a low is formed near $10,302. Bitcoin is currently correcting higher and trading above the $10,400 level.
There was a break above the 23.6% Fib retracement level of the recent dive from the $10,989 high to $10,302 low. It seems like there is a major contracting triangle forming with resistance near $10,470 on the hourly chart of the BTC/USD pair.
Bitcoin price dives below $10,555. Source: TradingView.com
If there is an upside break, the price could test the $10,550 resistance (support turned resistance). The next major resistance is near the $10645 level since it is close to the 50% Fib retracement level of the recent dive from the $10,989 high to $10,302 low. The main resistance is now near the $10,800 zone and the 100 hourly simple moving average.
Risk of More Losses in BTC?
If bitcoin fails to recover above the $10,550 and $10,650 levels, there is a risk of more losses. An initial support is near the recent low and $10,300.
The main support on the downside is near the $10,200 zone, where the bulls might take a strong stand. However, if the current bearish pressure remains intact, there could be a sharp decline below $10,200 and $10,000.
Technical indicators:
Hourly MACD – The MACD is slowly moving in the bullish zone.
Hourly RSI (Relative Strength Index) – The RSI for BTC/USD is recovering and approaching the 40 level.
Major Support Levels – $10,300, followed by $10,200.
Major Resistance Levels – $10,550, $10,645 and $10,800.