
An unfilled $870 dollar gap on the CME Bitcoin Futures chart is spreading worries of another serious bitcoin price decline, which could send BTC packing all the way back to $7.1K. Let’s take a look.
BTC1! CME Future Chart 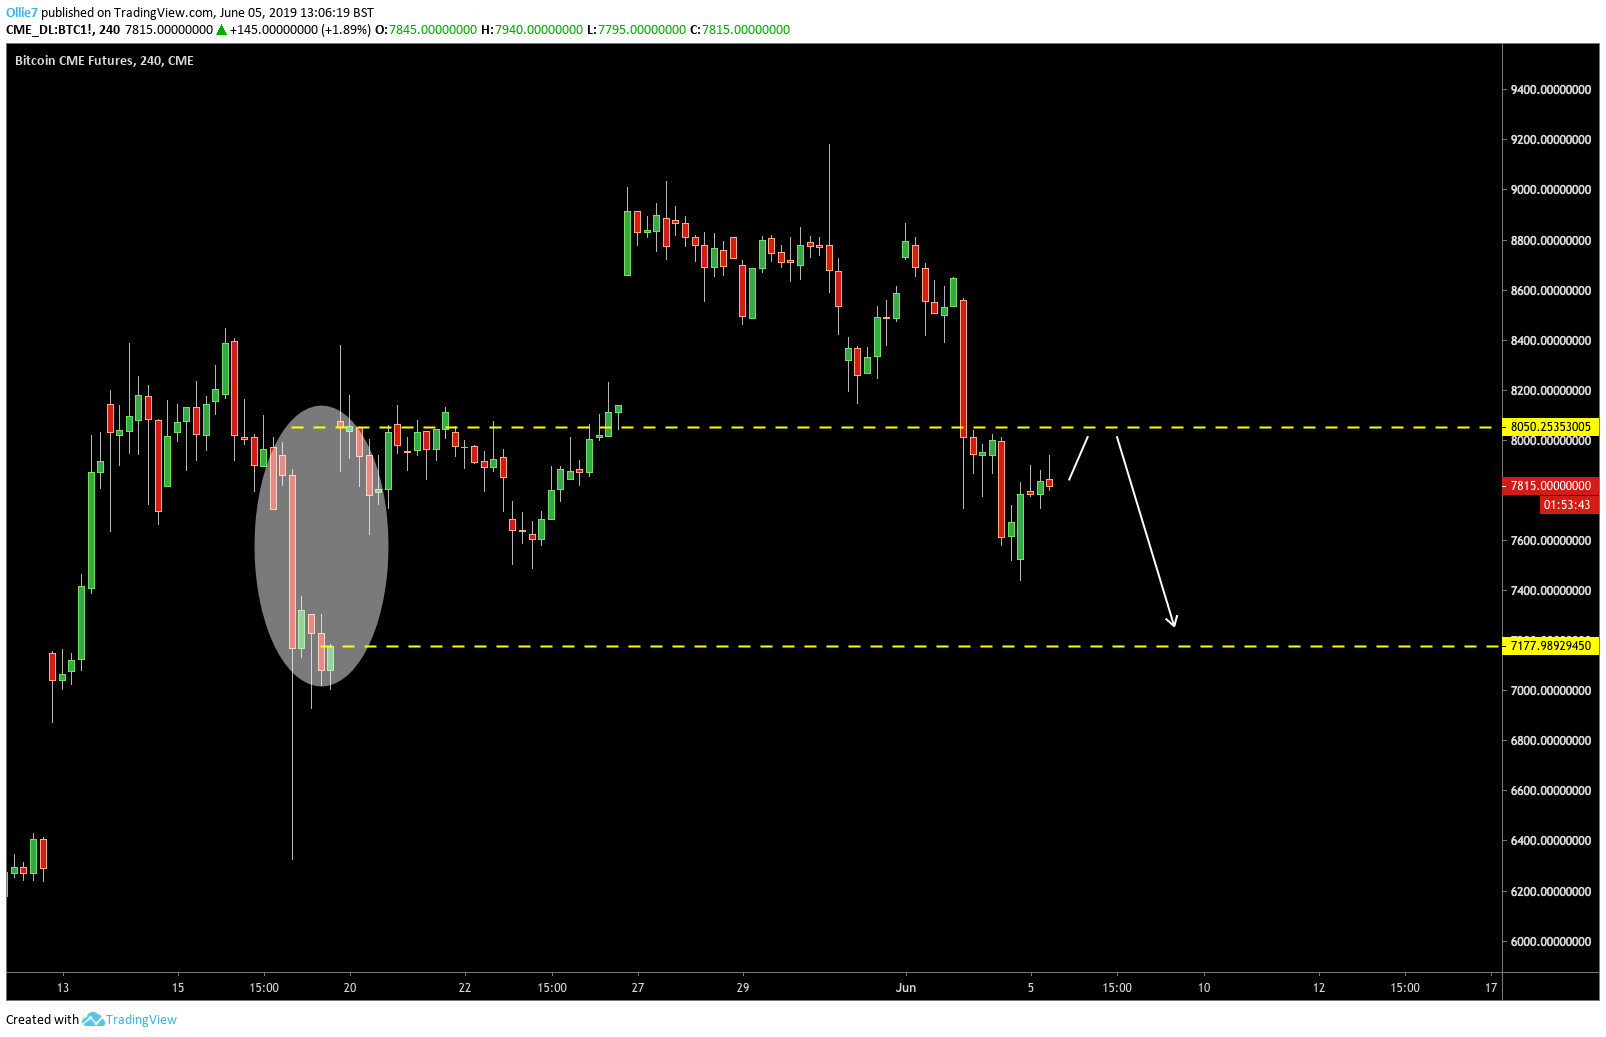
On the daily BTC1! Futures chart, we can see a significant gap between the $7,177 and $8,050 levels has still yet to be filled. Gaps like this commonly occur in traditional financial markets, when the price of the underlying asset moves sharply during market closing hours. Once the market reopens, the difference between the previous close and the new open price is shown as a blank space in the trend.
These gaps draw a lot of attention from traders and often become key price targets during later trades. “Filling the gap” is the process that happens once the price retraces nearly to where the gap previously formed and causes the price to suddenly spike or crash between the two price points.
Looking at the chart above, we can see that a number of gaps have already been filled over the past 6 weeks – including the $760 gap from May 10-12, and the more recent $500 gap between May 24 – 26.
What we are expecting to happen now over the rest of this week is for Bitcoin bulls to launch an upside recovery to the psychological $8K level, capitulate against the strong selling pressure, and fill the gap towards the $7.1K mark.
BTC/USD 4-Hour Chart
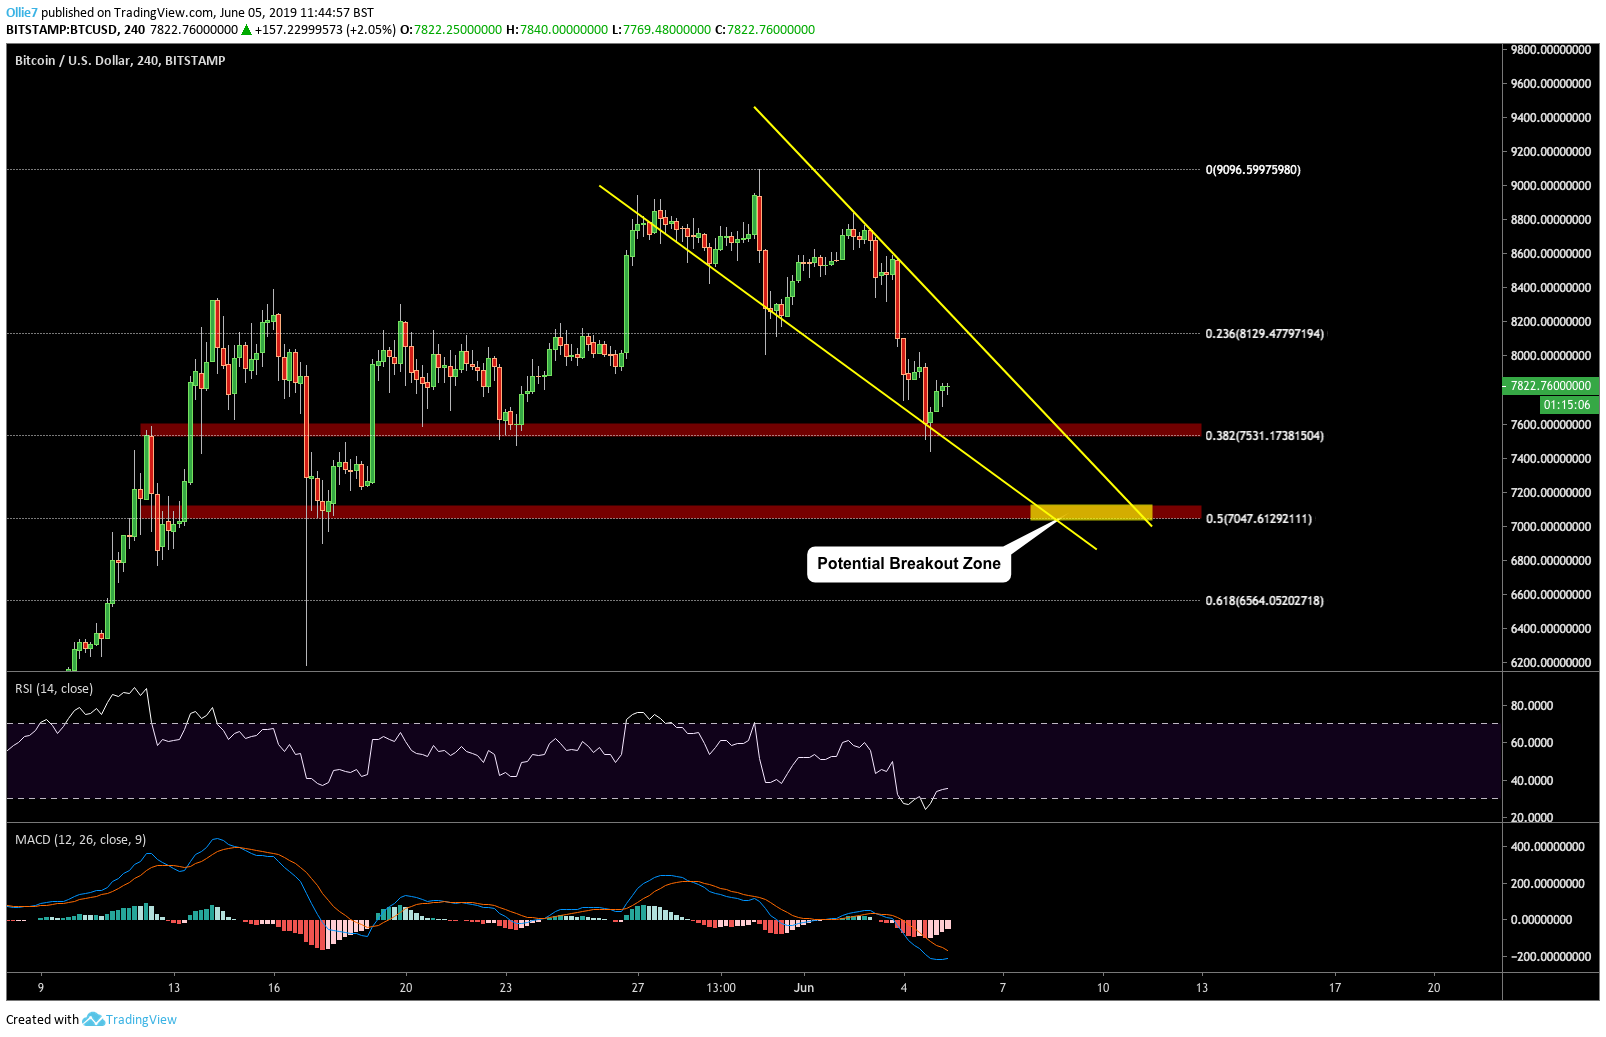 Running with this idea, we can see that the 4-Hour bitcoin price 00 appears to be tracking inside a bullish falling wedge pattern, which seems likely to terminate at the key 0.5 Fibonacci support. This particular level sits at $7,047, which lines up nicely with the CME gap close price.
Right now we can see that BTC has found temporary refuge at the 0.382 Fibonacci level ($7,531), which has been a prominent support/resistance level for bitcoin during Q2.
Bullish traders have already been able to claw back the $7,700 support since this morning’s red market, and the current momentum looks promising on the RSI and MACD indicators. This further cements that BTC could be on its way to retracing back to the $8/ $8.1K level.
If and when the gap is filled, we could see BTC price continue to consolidate inside the bottom of the falling wedge pattern before eventually breaking bullish. This is likely to take place around the 0.5 Fibonacci, as buying pressure at the psychological $7K mark helps to support the recovery.
[The views and opinions of the writer should not be misconstrued as financial advice. For disclosure, the writer holds Bitcoin at the time of writing.]
Images courtesy of Shutterstock, Tradingview.com
The post Bitcoin Futures CME ‘Gap’ Sparks Fears of Another Price Collapse appeared first on Bitcoinist.com.