
Bitcoin price is slowly gaining momentum and it broke the $10,700 resistance against the US Dollar. BTC is up 5%, but it is still facing a major resistance near $10,800 and $11,000.
- Bitcoin is rising and it broke the $10,500 and $10,700 resistance levels.
- It is now trading well above the $10,580 pivot level and the 100 hourly simple moving average.
- There was a break above a key contracting triangle with resistance near $10,440 on the hourly chart of the BTC/USD pair (data feed from Kraken).
- The pair is still facing a crucial breakout resistance near $10,800 and $11,000.
Bitcoin Price is Gaining Traction
There was a steady rise in bitcoin price from the $10,200 support zone against the US Dollar. BTC broke the $10,500 resistance level to start the recent increase.
The bulls even pushed the price above the $10,580 pivot level and the price settled well above the 100 hourly simple moving average. The upward move gained pace after there was a break above a key contracting triangle with resistance near $10,440 on the hourly chart of the BTC/USD pair. The pair even broke $10,700 and spiked above $10,800.
Bitcoin price traded as high as $10,827 and it is currently showing a lot of positive signs. If there is a downside correction, the price might find support near $10,730 or the 50% Fib retracement level of the recent rise from the $10,633 swing low to $10,827 high.
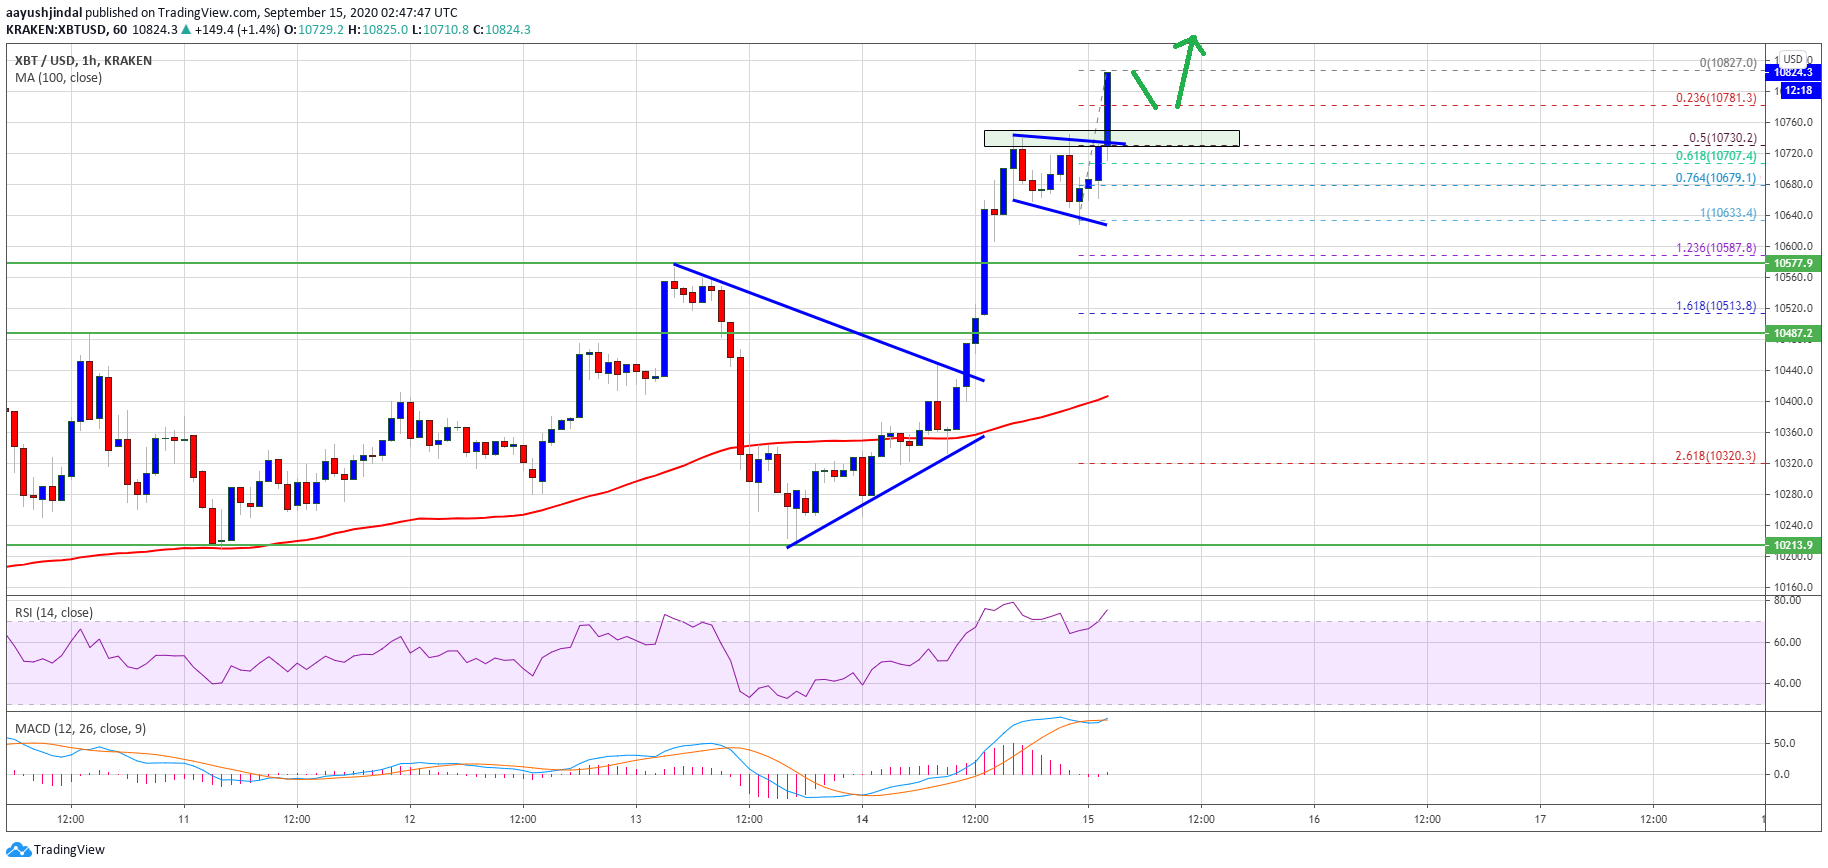
Bitcoin price trades above $10,700. Source: TradingView.com
On the upside, the bulls are likely to face a lot of hurdles near $10,800, $10,850 and $11,000 (as discussed in the weekly analysis). A successful close above the $11,000 resistance is needed for a sustained upward move.
Fresh Decline in BTC?
If bitcoin fails to clear the $10,800 resistance or the $11,000 barrier, there is a risk of a downside correction. An initial support is near the $10,730 level.
The first major support is near the $10,700 level or the 61.8% Fib retracement level of the recent rise from the $10,633 swing low to $10,827 high. Any further losses could lead the price towards the $10,580 level (previous resistance now support), where the bulls are likely to take a stand.
Technical indicators:
Hourly MACD – The MACD is currently gaining pace in the bullish zone.
Hourly RSI (Relative Strength Index) – The RSI for BTC/USD is currently well above the 65 level.
Major Support Levels – $10,700, followed by $10,580.
Major Resistance Levels – $10,800, $10,850 and $11,000.