
Bitcoin was up to its trademark tricks late on Friday and early into Saturday with some particularly volatile moves. We take a look at the action and what it may mean moving into the weekly close.
Bitcoin (BTC) has been trading the week within a $200 range with lows of $3700 established on Monday and highs of $3900 tested on Wednesday. Since then, the bulls have been peppering the upper $3800 range and have looked, generally, in control of the price action.
4 Hour Chart
Late on Friday, the bears smacked the price back down to just beyond the middle of the week’s range, finding a low of £3760 (-3.5 percent), which was bought back up — pushing the price to new weekly highs. This sort of unusual price action tends to occur preceding a more definitive move.
The four-hour MACD is currently crossed bullish and trending above zero, which is in confluence with the stochastic RSI — which is also turned bullish. Combined with the general trend for the week being upward, the evidence at face value favors the bulls going into Saturday.
Weekly Chart
The weekly chart shows that the volatility at these levels may somewhat be explained by the declining long-term resistance being very close to the current price. This price action just below at the 100 and 50 WMA cross, while being supported by the 200 WMA, is very similar to that which occurred in 2015.
This took several months to resolve and ultimately led to a test of the declining 50WMA, which is currently declining from $6,000. It took 10 further weeks to test the 50 WMA following the cross under similar circumstances in 2015, which would take us to the end of April and somewhere in the $5,000 range. This test back in 2015 led to the 200 WMA being backchecked so, should this occur again, we would have clear battle lines drawn.
The bearish case is that Bitcoin has failed to break this resistance for 12 months, so what would lead us to conclude that this time it may be different?
Bulls Target $5K
In a TradingView post, I put forward the idea that a $5k Bitcoin price may be possible and that the main reasons behind this are that there are such a large number of bullish underlying indicators to support this notion, namely being the MAC-D, the CMF, Fibonacci levels, and the fact that we have made higher lows across a number of months.
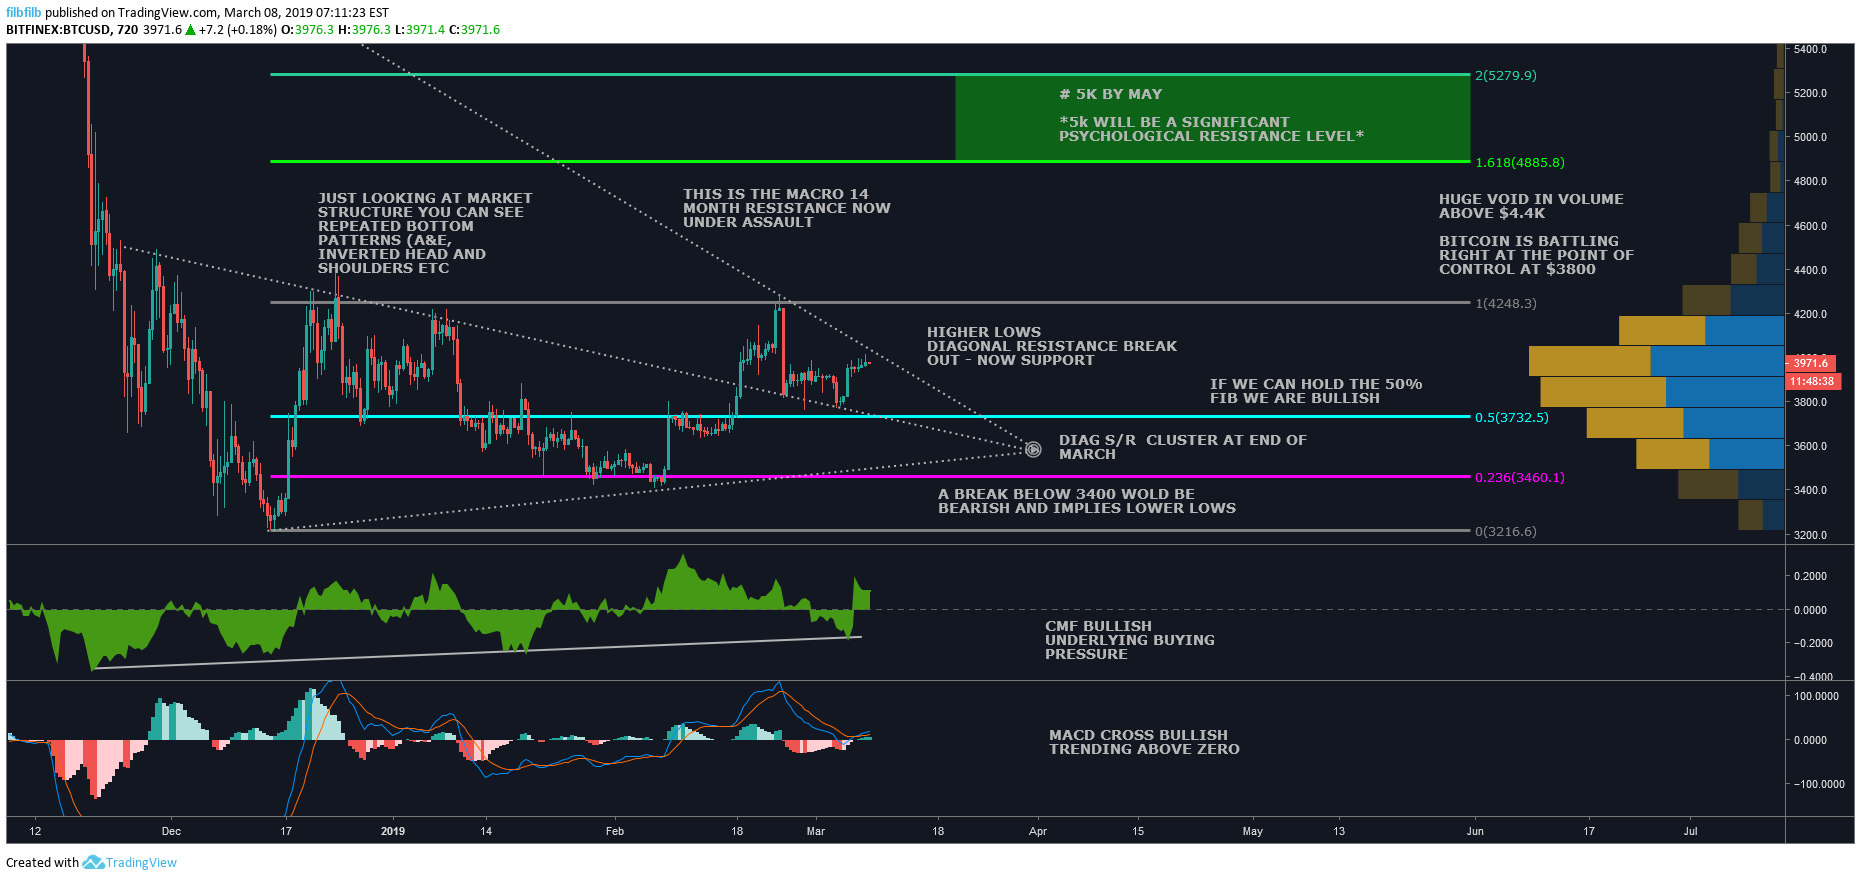
Only time will tell if this prediction will play out and it is a prediction against the grain of a 14-month bear market, so it should be treated with caution. A low beyond $3400 and a lower low / break in market structure would certainly imply that the bears are still in command after a short period of hibernation.
Trade Bitcoin, Litecoin and other cryptocurrencies on online Bitcoin forex broker platform evolve.markets.
To get receive updates for the writer you can follow on Twitter (@filbfilb) and TradingView.
All charts courtesy of TradingView.
The views and opinions of the writer should not be misconstrued as financial advice. For disclosure, the writer holds Bitcoin at the time of writing.
The post Bitcoin Price Analysis: Not As Bearish As You Think appeared first on Bitcoinist.com.