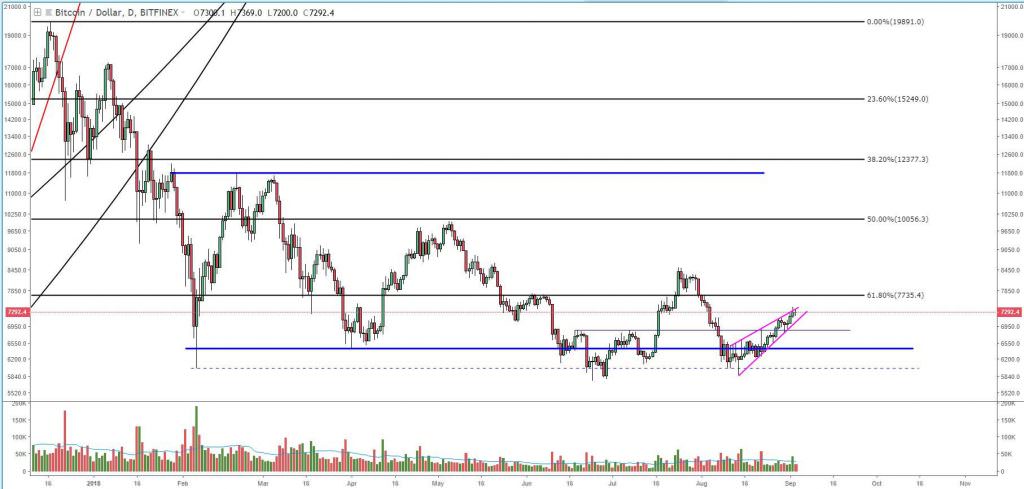
In a potentially trend-changing move, bitcoin has now managed establish its first *higher* low since the beginning of this years crypto bear market. In mid-June, after seeing a short-lived bounce from this year’s low in the upper $5,000s, the bitcoin market took a very harsh, unrelenting move that dropped the price from the mid $8000s to the $5900s. After such a strong move, the market managed to stabilize just above its previous low:
Figure 1: BTC-USD, Daily Candles, New Higher Low
Currently, the market is enjoying a steady climb from its newly established, higher low. This marks the first time since the beginning of the bear market that we’ve held support above a previous low. Although this is a definite bullish trend signal, there is still some proving ground left for this market if it’s going to shake off its bearish ways. The next line of defense for the bears lies at the 61%, macro Fibonacci retracement value shown below:
 Figure 2: BTC-USD, Daily Candles, 61% Fib Retracement
As you can see, the level outlined above has been a point of significance, time and time again, throughout the life the bear market. If the market can break above the resistance level and manage to turn it into support, that would be a *huge* win for the bulls and it would further support the idea of a trend change for this bear market.
So far, every time we have broken the resistance, we have failed to find support at this level. Finding support would indicate supply has been shaken out at the lower levels and has been properly absorbed by the market. In order for the market to find a meaningful uptrend, supply must be absorbed by the bulls.
Another trend-changing characteristic we would like to see is the break of the downward trendline shown below in red:
 Figure 3: BTC-USD, 12-Hour Candles, Downtrend Line
At the time of this article, we are butting right up against the downtrend line. The current price level is very important as it has a large number of things that, if broken, will likely signal a strong round of buying.
Not only is there a significant price level for trend pivots, but it is also the trendline that has defined the market over the last 7 months. While establishing a higher low is *definitely* important, what’s more important, in my opinion, is the test of the downtrend line and the 61% Fib level.
Summary:
- Bitcoin managed to hold a higher low for the first time since the beginning of the bear market.
- It is currently seeing a strong rally that has it testing key resistance of both the downtrend line, and the 61% Fib level.
- Volume is currently relatively low, but if we break above the resistance and hold support, this will be a very strong signal for the bulls to step in.
- Until we break above resistance and hold support, this rally could be just another rally in an otherwise volatile market. Keep an eye out for the current price level because it’s a very important level to watch.
Trading and investing in digital assets like bitcoin and ether is highly speculative and comes with many risks. This analysis is for informational purposes and should not be considered investment advice. Statements and financial information on Bitcoin Magazine and BTC Media related sites do not necessarily reflect the opinion of BTC Media and should not be construed as an endorsement or recommendation to buy, sell or hold. Past performance is not necessarily indicative of future results.