
The Bitcoin price has struggled below $17,000 for multiple weeks now, and it recently dipped below the $16,900 mark. This downward move on the Bitcoin chart could be attributed to the recent Federal Open Market Committee (FOMC) minutes.
The minutes of the meetings revealed that the Federal Reserve System would stick with higher interest rates for the foreseeable future.
This has evidently sent ripples through the market, causing participants to react negatively. The technical outlook of the asset has reflected a fall in accumulation, but indicators are still positive about the Bitcoin price over the upcoming trading sessions. From the daily chart, it can be inferred that BTC will make a recovery in the next trading sessions.
Bitcoin continues to hold itself steady above the $16,600 price mark. Currently, the price of the asset is consolidated, with major altcoins following the same price trajectory. Over the last 24 hours, BTC slipped 0.6%. The Bitcoin price at the moment is trading at a 76% discount from its all-time high of 2021. The market capitalization of Bitcoin decreased slightly, indicating that sellers outnumbered buyers at press time.
Bitcoin Price Analysis: One-Day Chart
BTC was trading at $16,700 at the time of writing. The coin recently lost the $16,800 support level; however, this is extremely short-term as BTC will soon initiate recovery on the chart.
A slight push from the buyers will help BTC propel itself above the $16,800 mark, which indicates that the overhead resistance for the coin stood at $16,900.
Clearing the $16,900 price mark will pave the way up to $17,000. On the other hand, if demand doesn’t show up immediately, BTC could retrace further to sit at $16,600 before it starts to move northward again. The amount of BTC traded in the last session declined to indicate slight bearishness.
Technical Analysis
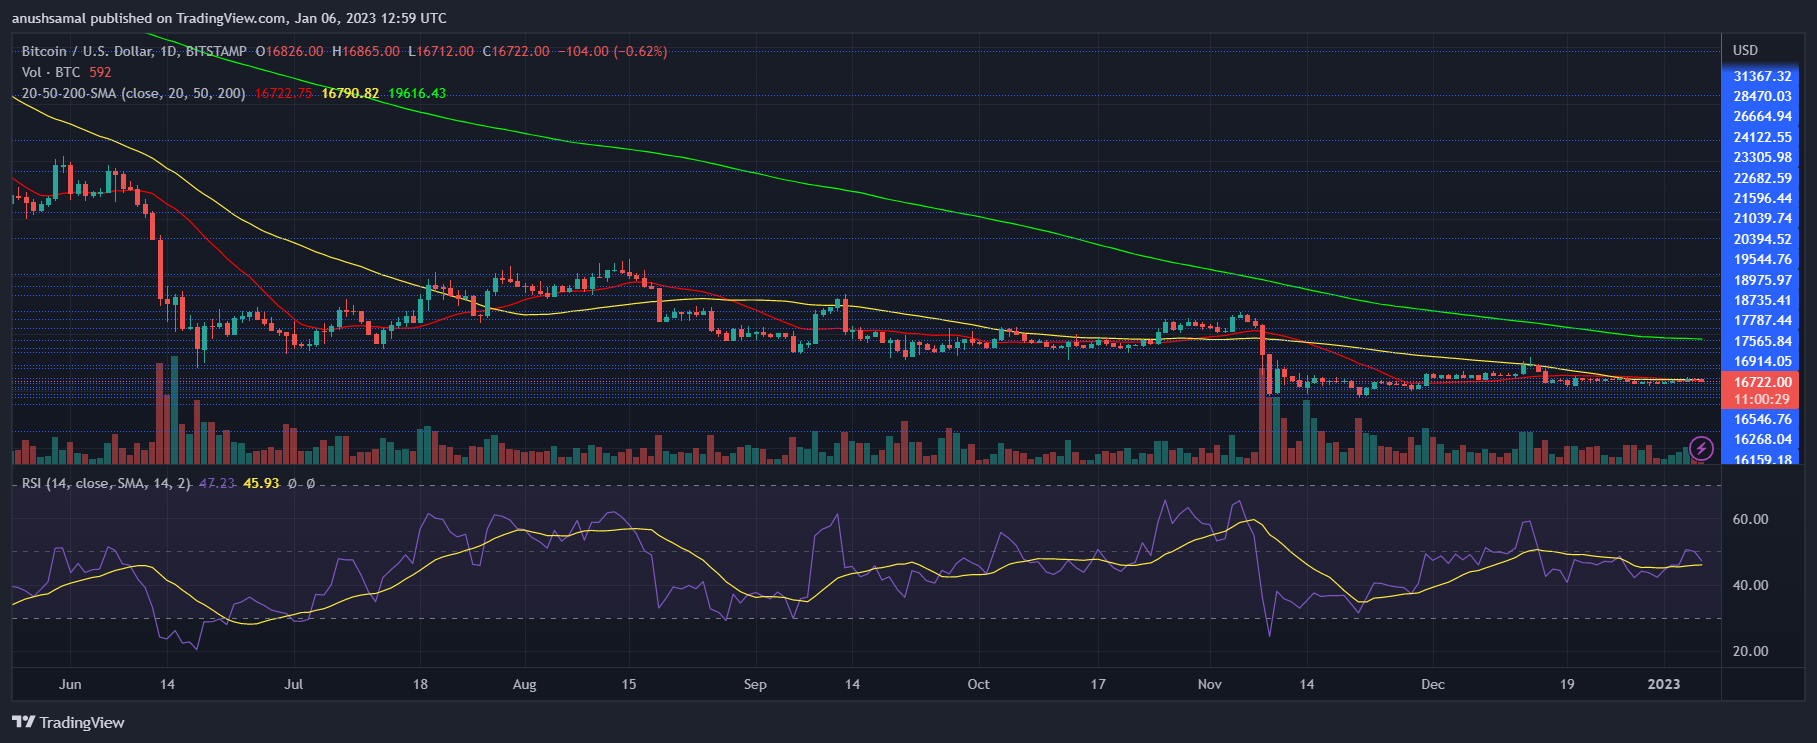
Despite a fall in the number of buyers, the technical outlook has managed to remain positive for Bitcoin price. The Relative Strength Index noted a downtick, which indicated that buyers were slowly exiting the market. On the other hand, however, Bitcoin has displayed a positive sign on the daily chart.
The price of the asset was above the 20-Simple Moving Average line (SMA), which meant that buyers still had the upper hand in driving the price momentum in the market. Additionally, the 50-SMA (yellow) was below the 20-SMA (red) line; this is a golden cross, a pattern that is formed before the coin starts a rally.
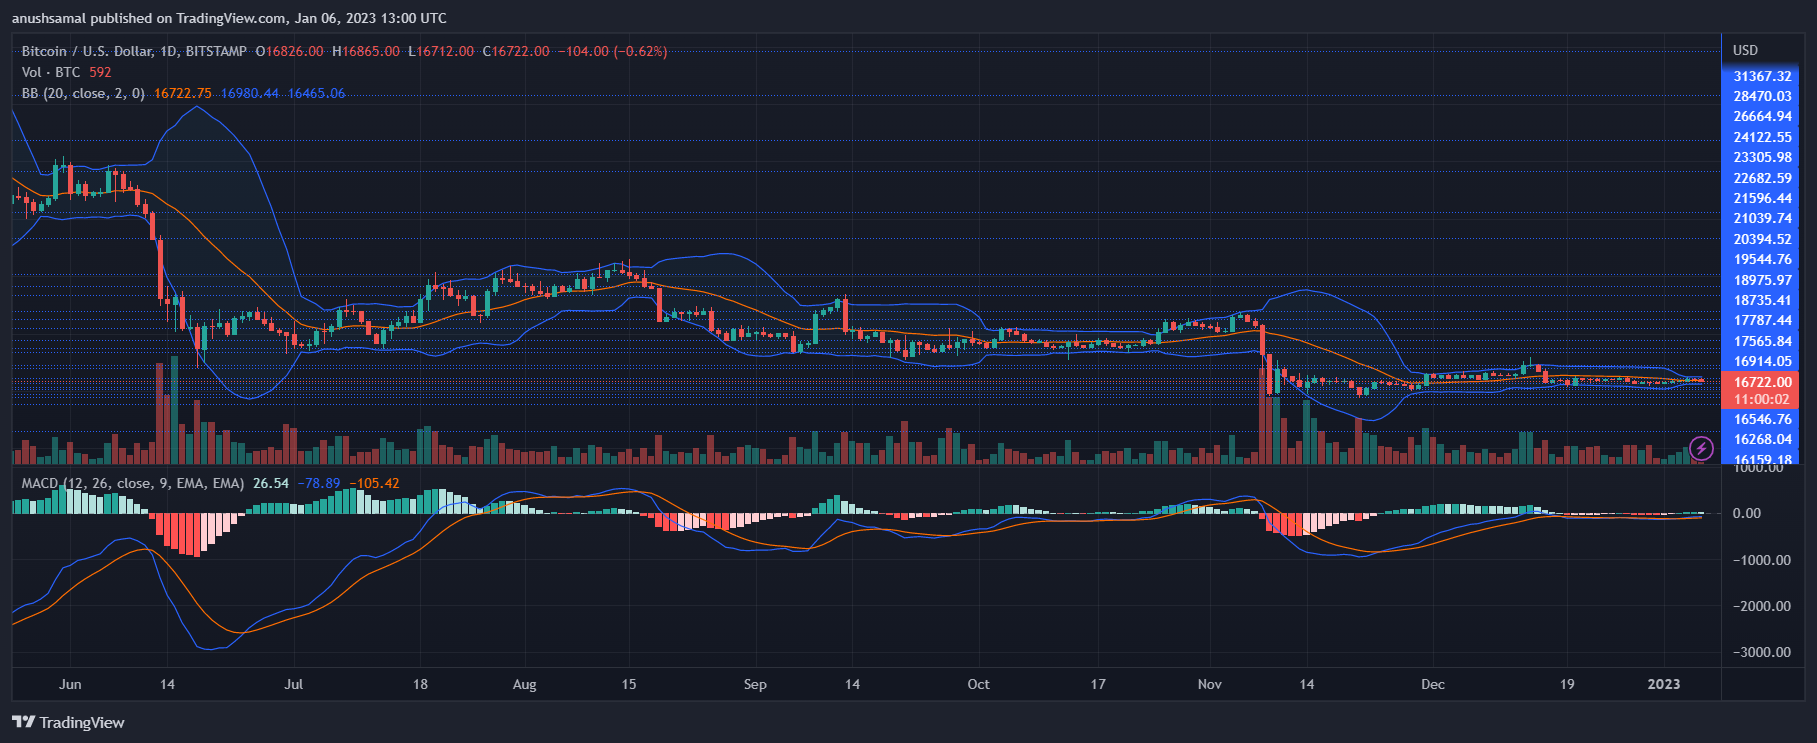
In accordance with incoming bullish strength, Bitcoin price depicted a buy signal on the daily chart. The price momentum is indicated by the Moving Average Convergence Divergence, which showed green signal bars.
Related Reading: Ethereum Gains 4.5% in Weekly Timescale As Shanghai Upgrade Nears
These bars were buy signals, which also aligned with the idea that the price of the asset was about to go up. Bollinger Bands illustrate volatility and future fluctuations in price. The bands were heavily constricted, in a squeeze, indicating a sharp turn in price and possible trading opportunities for traders.
Featured Image From UnSplash, Charts From TradingView