
Bitcoin buyers appear to be eyeing the psychological $8,200 above today, but fears of a rising wedge reversal could put an abrupt end to the rising price. Let’s take a closer look.
Bitcoin 4-Hour Chart
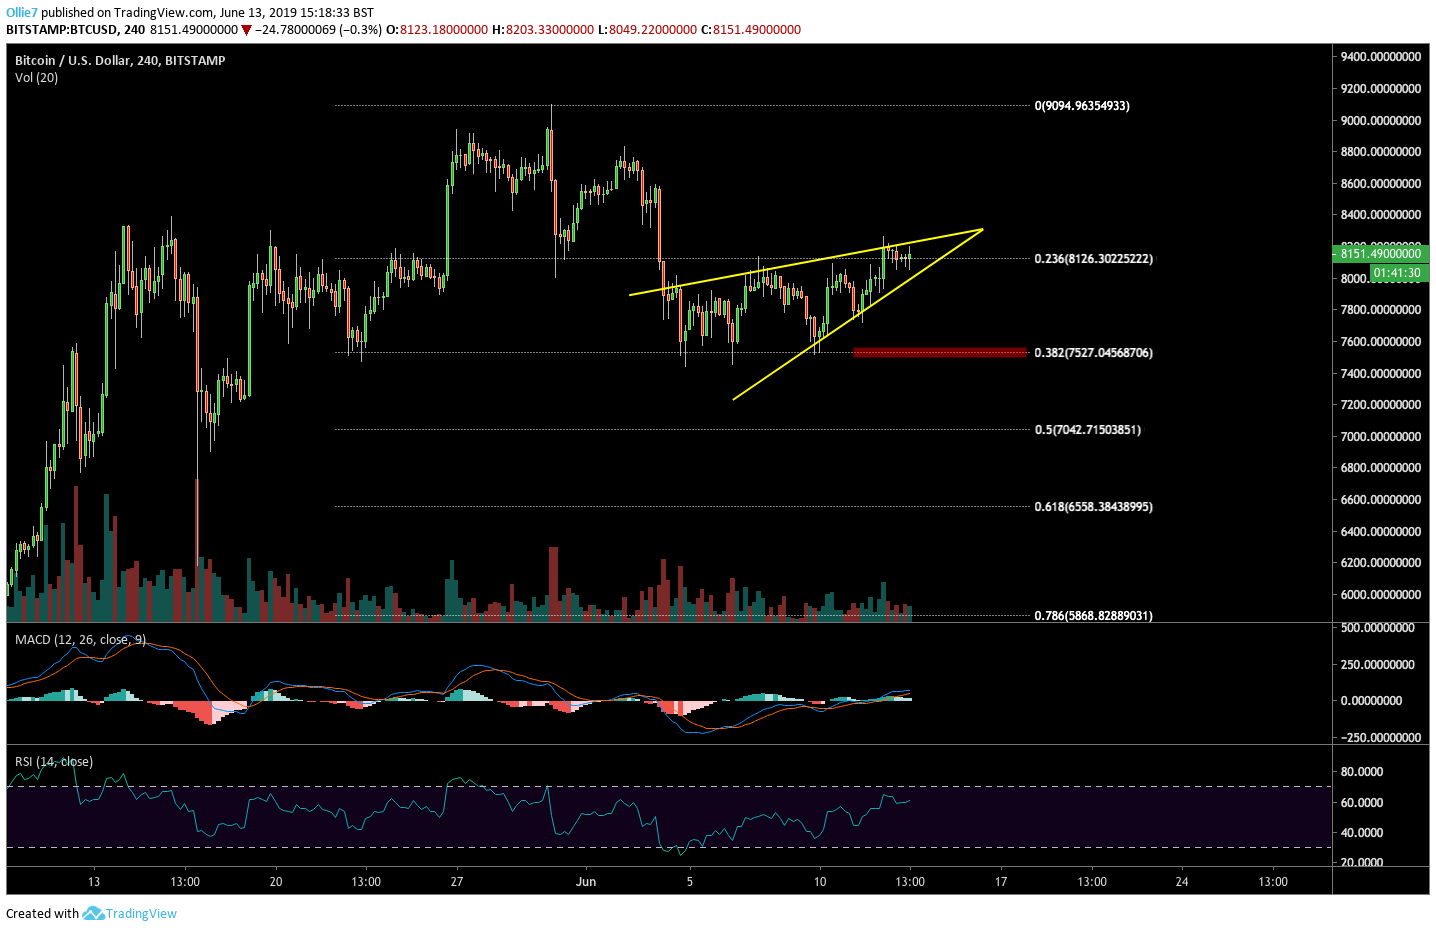
On the 4-Hour BTC/USD chart, the price appears to be consolidating inside a bearish rising wedge pattern between two pinching trendlines. This pattern usually marks the start of a bearish reversal, as bullish momentum thins out ahead of strong resistance.
In this case, the $8,200 level is the strong resistance and has played a critical role in preventing Bitcoin price 00 from retesting its recently printed new YTD-high at $9,096.
The 0.236 Fibonacci level at $8,126.30 has also been a pivotal resistance against Bitcoin’s price, particularly during the last week of May when BTC was approaching maximum consolidation inside the ascending triangle. Bullish traders, however, have so far managed to secure this particular level during the last candle but buying volume on the MACD appears to be decreasing as they start to weaken.
What we are expecting to see, is bitcoin buyers continue to press on towards the $8,200 before running into strong selling pressure from auto-trading bots and short-term investors. The overlapping resistances from both the rising wedge and the $8,200 price point, will be a very difficult area to overcome and will need significant bullish volume to do so.
Furthermore, the RSI is now only 5% away from the overbought region above which will likely create additional friction in the uptrend. AND, there is also the $870 CME gap looming between the $8,000 and $7,130 levels, which we looked at in an earlier analysis.
Should bears take back control of the asset, and the rising wedge pattern plays out, then the $7,500 price point at the 0.382 Fibonacci level may provide temporary support in the short-term, but the CME gap could potentially drag Bitcoin’s price down further towards the $7,100 level.
If buyers succeed in closing above $8,200 however, we could see an attempt to reject the rising wedge pattern with a bullish breakout above the uptrending resistance. If that takes place, then we could see Bitcoin’s price retake the $8,320 level above before throwing back on to the previous resistance as new support.
2-Hour Chart
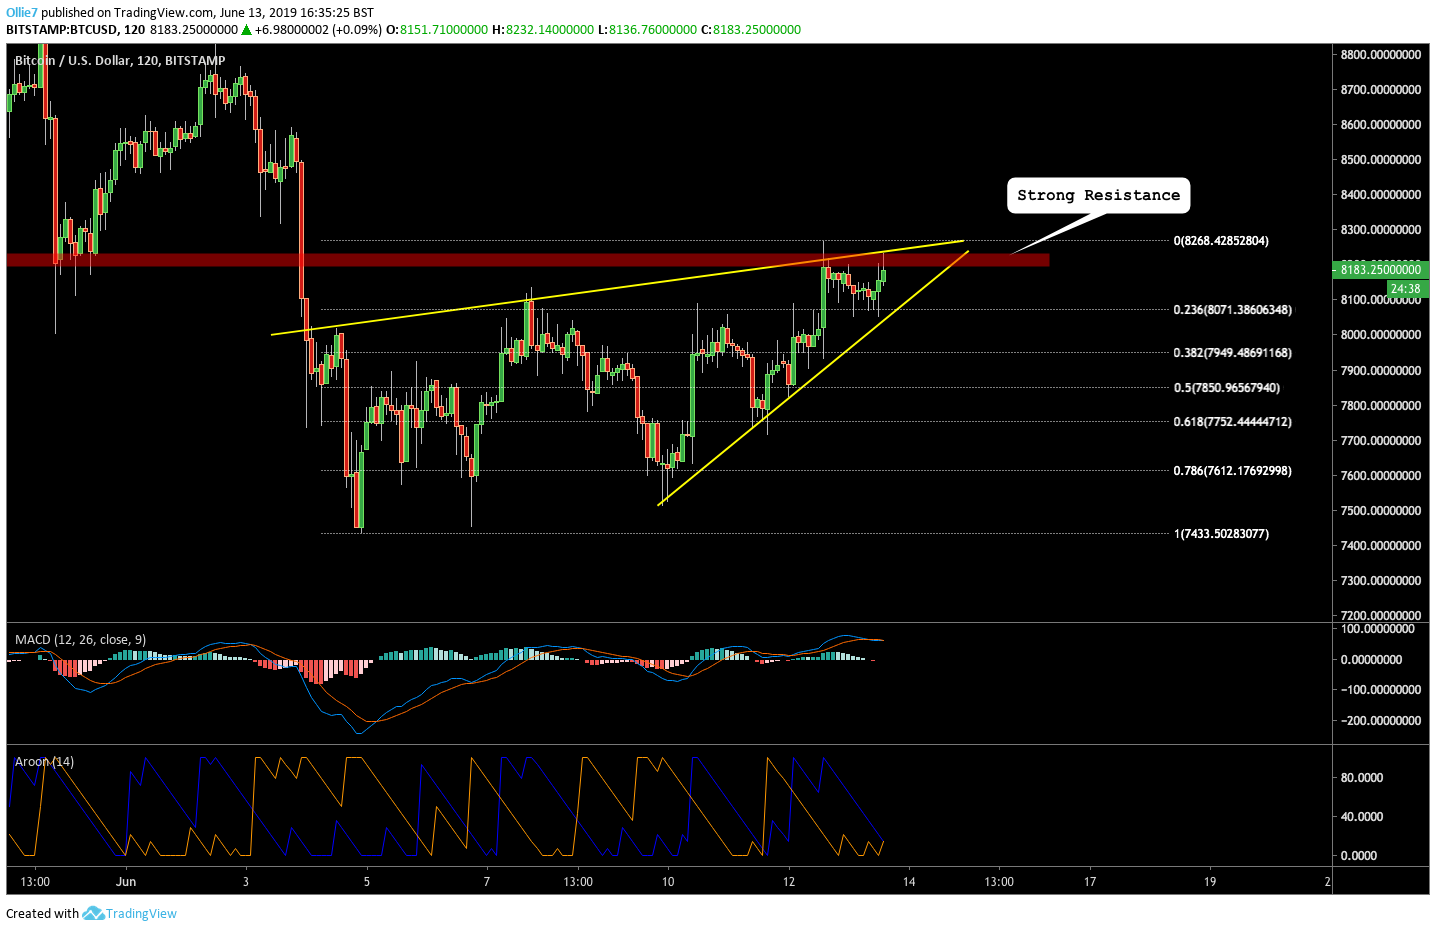
Over this closer time period, we can see a number of other signals favor bearish traders in the Bitcoin market right now.
On the MACD indicator, buying volume is close to flipping bearish on the histogram and the 12MA appears to be about to bearishly diverge beneath the 26MA.
On the Aroon indicator, we can see that the Aroon Up line (blue) is also now diverging beneath the Aroon Down line (yellow), which suggests that the current uptrend is weakening.
This is usually a good indicator to use to spot reversing trends, as it cross-references the number of highs and lows a price reaches within the last 14 periods. A higher amount of lows vs a decreasing number of highs causes the Aroon Up line to diverge with the Aroon Down line and indicates a change in momentum.
How do you think Bitcoin will perform over the rest of the week? Let’s us know in the comment section below!
[Disclaimer: The views and opinions of the writer should not be misconstrued as financial advice.]
Images courtesy of Shutterstock, Tradingview.com
The post Bitcoin Price: Bulls Under Pressure to Break $8.2K in Rising Wedge appeared first on Bitcoinist.com.