
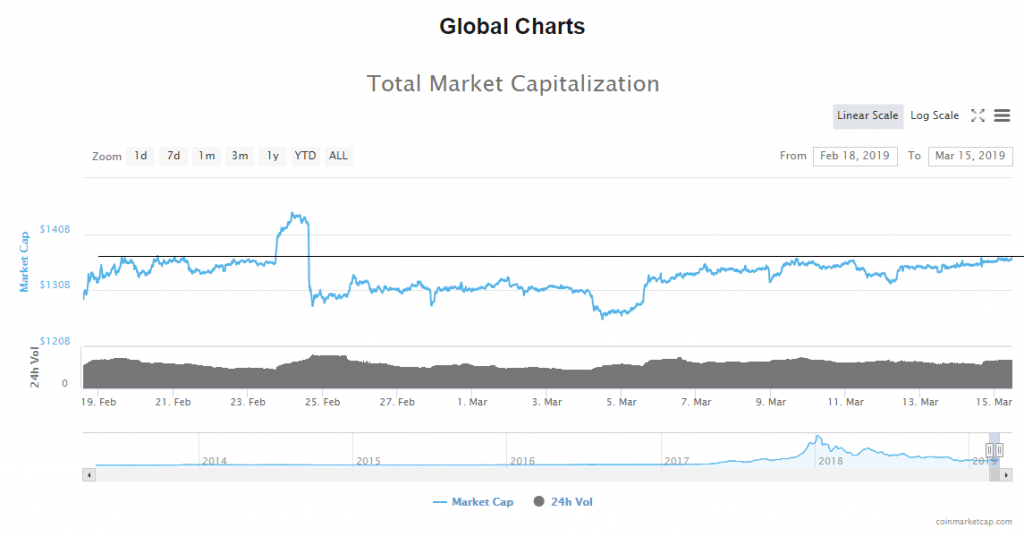
From yesterday’s low at $134,128,978,332 the evaluation of the cryptocurrency market cap has continued its slight upward trajectory and finally came to its upper resistance level as its currently sitting at around $135,6B.
Trade Bitcoin with 3Commas
Looking at the global chart, we can see that the evaluation came to its horizontal resistance level where the interaction has been made today which is why we could see a rejection today with the evaluation moving to the downside as the seller’s territory is just slightly above.
The market is in mixed color with an insignificant percentage of change in the last 24 hours as the prices are hovering around the same levels as yesterday. The biggest gainer is Crypto.com Chain with an increase of 43% and Qtum with an increase of 17%. The biggest loser is Aurora with a decrease of 6.95%.
Bitcoin’s market dominance has continued its downward trajectory and has fallen below the 51% level today, coming to 50.89% at its lowest point today.
Bitcoin BTC/USD
From yesterday’s low at $3936.8 the price of Bitcoin has increased by 1.46% today measured to the highest point the price has been at around $3994. The price has retraced slightly since and is currently sitting at around $3989.

On the hourly chart, we can see that the expected interaction with the significant horizontal resistance level at $3994.4 has been made today. This horizontal level was well respected in the past and the zone above it is considered to be the sellers’ territory which is why now that the interaction occurred we are most likely to see another pullback which is the expected ABC correction to the downside.
As you may know, I am expecting the price of Bitcoin to retrace back to around $3826 area before another upswing to the most significant resistance area at $4200.
Zooming out on to the 4-hour chart you can see that the price of Bitcoin created a similar structure to the one when the Intermediate W wave ended which is why a similar scenario is expected.
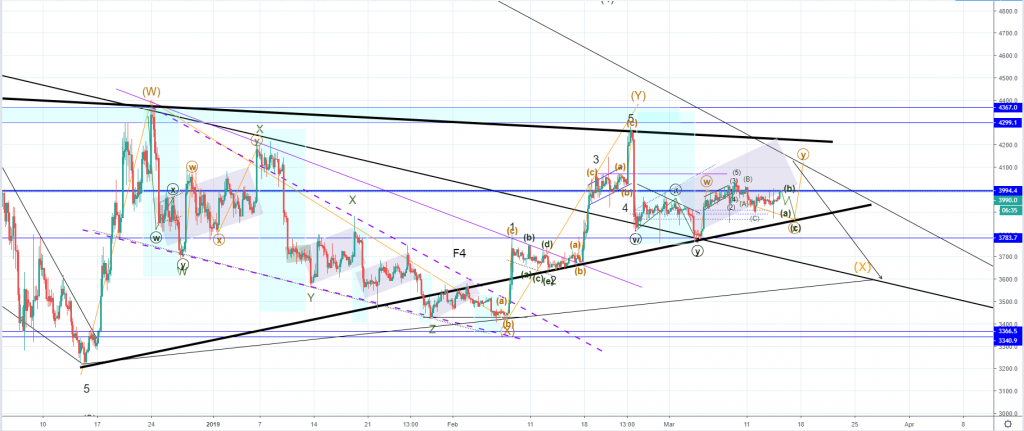
The fractals are also implying that from here another upswing would be made on the second corrective structure after the increase and will most likely retest the falling wedge of a higher degree resistance line as the second correction after the W wave retested its support.
As the WXY correction ended we could be either seeing the impulsive five-wave move to the downside in which case this corrective structure from 25th of February would be the second wave and the drop on 25th would be the first. This means that the price of Bitcoin is soon to start developing its third wave to the downside so after this upswing ends I would be expecting the price of Bitcoin to go back to its first significant support at around $3595 where the intersection between the falling wedge support is and the ascending triangle’s support level.
If the price doesn’t go further below the ascending triangle’s support I would consider that the movement was the second wave X as the correction got prolonged by two more waves in which case another retest of the upper resistance zone would be a possibility before we are to see new lower lows for the price of Bitcoin.
Zooming out further on to the daily chart you can see my Elliott Wave count clearly, and as you can see I am considering this Intermediate correction as the 4th wave out of the five-wave move to the downside which is why after it ends I would be expecting lower lows.
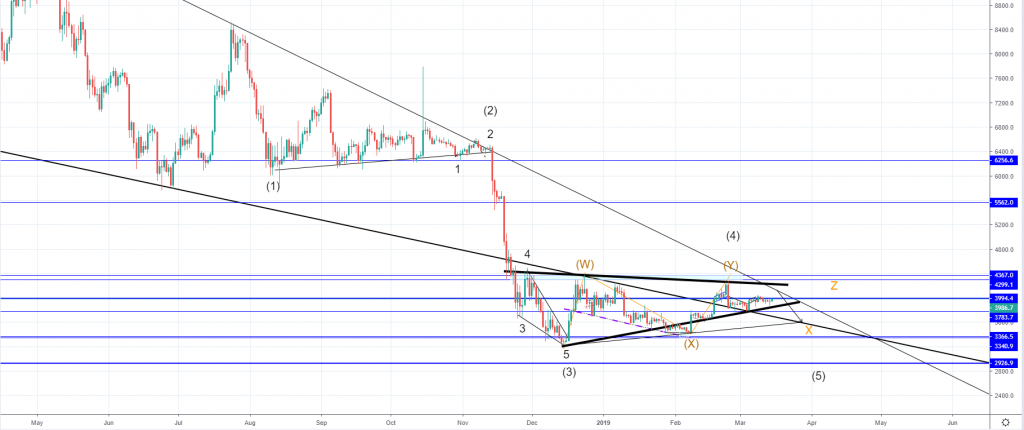
The price has been correcting below the resistance zone which was broken on the way down and below which the price of Bitcoin has been since 23rd of November. Although we have seen some bullish momentum until we break out to the upside I am not considering changing my projected scenario as nothing has changed drastically which is why I am still bearish. The price of Bitcoin hasn’t interacted with the most significant support level at $2926 which is the lower level off of the support zone below so interaction with it on the 5th wave would be expected when this correction ends.
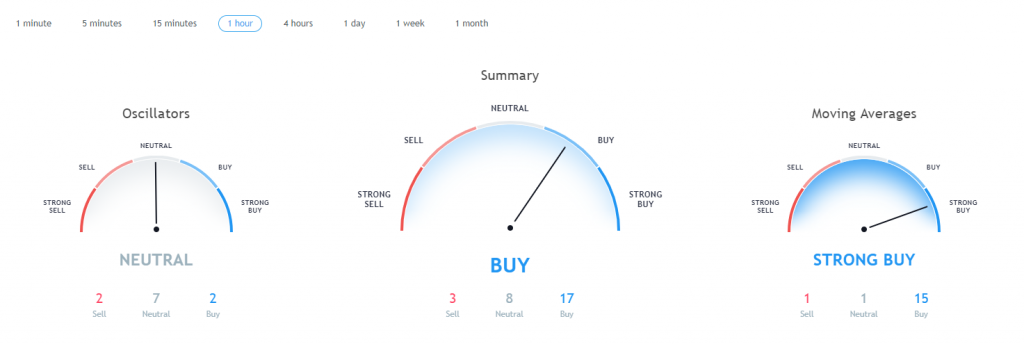
Market sentiment
Bitcoin is in the buy zone.
Pivot points
S3 3385.1
S2 3664.3
S1 3840.8
P 3943.5
R1 4120.0
R2 4222.7
R3 4501.9
Conclusion
As the global chart shows the evaluation came to its lower resistance levels which was also verified by the chart of Bitcoin as the interaction with the $3994.4 has been made.
This interaction with the upper resistance could set the price on a retracement today but it would only be a minor pullback before the prices increase a bit further as to retest its upper resistance points which would in the case of Bitcoin be around $4200 area.
After the price interacts with its upper resistance I would be expecting a strong move to the downside as this minor uptrend that we have seen from 25th of February is corrective in nature.
The post Bitcoin Price Prediction: Volume Building & Waiting for a Breakout appeared first on Blockonomi.

Blockonomi.com is author of this content, TheBitcoinNews.com is is not responsible for the content of external sites.
source: https://blockonomi.com/bitcoin-price-prediction-volume-building-waiting-for-a-breakout/
TheBitcoinNews.com is here for you 24/7 to keep you informed on everything crypto. Like what we do? Tip us some Satoshi with the exciting new Lightning Network Tippin.me tool!