
Bitcoin price gained bullish momentum and it broke the $16,500 resistance against the US Dollar. BTC is likely to continue higher towards $17,000 as long as it is above $16,200.
- Bitcoin regained strength and it broke the $16,500 and $16,600 resistance levels.
- The price traded to a new monthly high at $16,897 and settled above the 100 hourly simple moving average.
- There is a short-term contracting triangle forming with resistance near $16,725 on the hourly chart of the BTC/USD pair (data feed from Kraken).
- The pair could correct a few points, but the bulls are likely to remain active near $16,500.
Bitcoin Price Signaling More Upsides
After forming a base near the $15,800 level, bitcoin price started a fresh increase. BTC broke the $16,200 and $16,350 resistance levels to move back into a positive zone.
The upward move was such that the price broke the $16,500 resistance. The price traded towards the $17,000 level and a new monthly high was formed near $16,897. Bitcoin is currently consolidating gains below $16,800 and it is well above the 100 hourly simple moving average.
An initial support is near the $16,630 level. It is close to the 23.6% Fib retracement level of the recent rally from the $15,796 low to $16,897 high. There is also a short-term contracting triangle forming with resistance near $16,725 on the hourly chart of the BTC/USD pair.
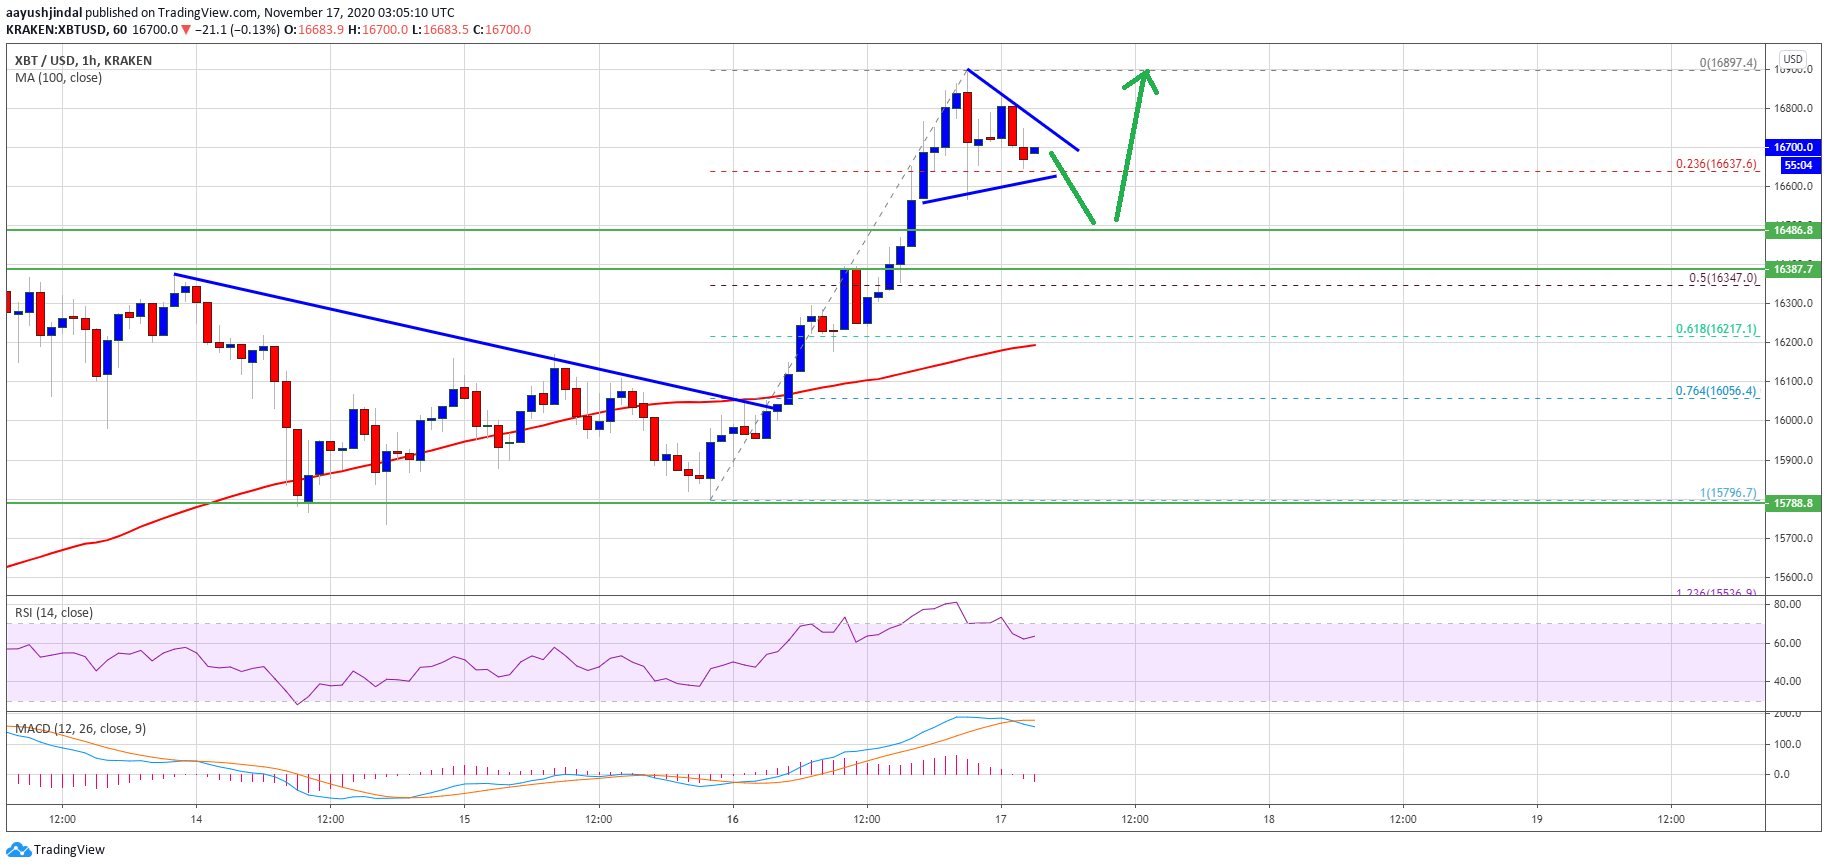
Source: BTCUSD on TradingView.com
The triangle support is close to the $16,630 level, below which the price could test the 50% Fib retracement level of the recent rally from the $15,796 low to $16,897 high.
On the upside, a clear break above the $16,725 and $16,750 levels might start a fresh increase. The next major resistance is near the $16,850 and $16,900 levels, above which the bulls are likely to aim a break above the $17,000 level.
Dips Supported in BTC?
If bitcoin fails to clear the triangle resistance or $16,750, there could be a short-term downside correction. A clear break below the triangle support might lead the price towards the $16,500 support zone.
The next major support is near the $16,350 level. Any further losses may perhaps lead the price towards the $16,200 support level and the 100 hourly simple moving average.
Technical indicators:
Hourly MACD – The MACD is slowly moving into the bearish zone.
Hourly RSI (Relative Strength Index) – The RSI for BTC/USD is currently correcting lower towards the 60 level.
Major Support Levels – $16,500, followed by $16,350.
Major Resistance Levels – $16,750, $16,850 and $17,000.