
Bitcoin price started a fresh increase above the $32,500 and $33,500 resistance levels against the US Dollar. BTC is showing positive signs, but $34,500 and $35,000 still presents a major resistance.
- Bitcoin is up over 10% and it broke the $34,000 resistance level.
- The price is currently trading well above the $33,200 pivot level and the 100 hourly simple moving average.
- There is a major bullish trend line forming with support near $33,200 on the hourly chart of the BTC/USD pair (data feed from Kraken).
- The pair could correct lower, but it is likely to find bids near $33,200 or $32,800.
Bitcoin Price Gains Over 10%
After forming a support base above $32,000, bitcoin price started a strong increase. BTC broke the $32,500 and $33,200 resistance levels to move into a short-term positive zone.
During the increase, there was break above a key bearish trend line with resistance near $31,550 on the hourly chart of the BTC/USD pair. The increase was such that the pair even cleared the $34,000 resistance and settled above the 100 hourly simple moving average.
A high was formed near $34,424 and the price is currently consolidating gains. An initial support is near the $33,200 level. It is close to the 23.6% Fib retracement level of the upward move from the $29,282 swing low to $34,424 high.
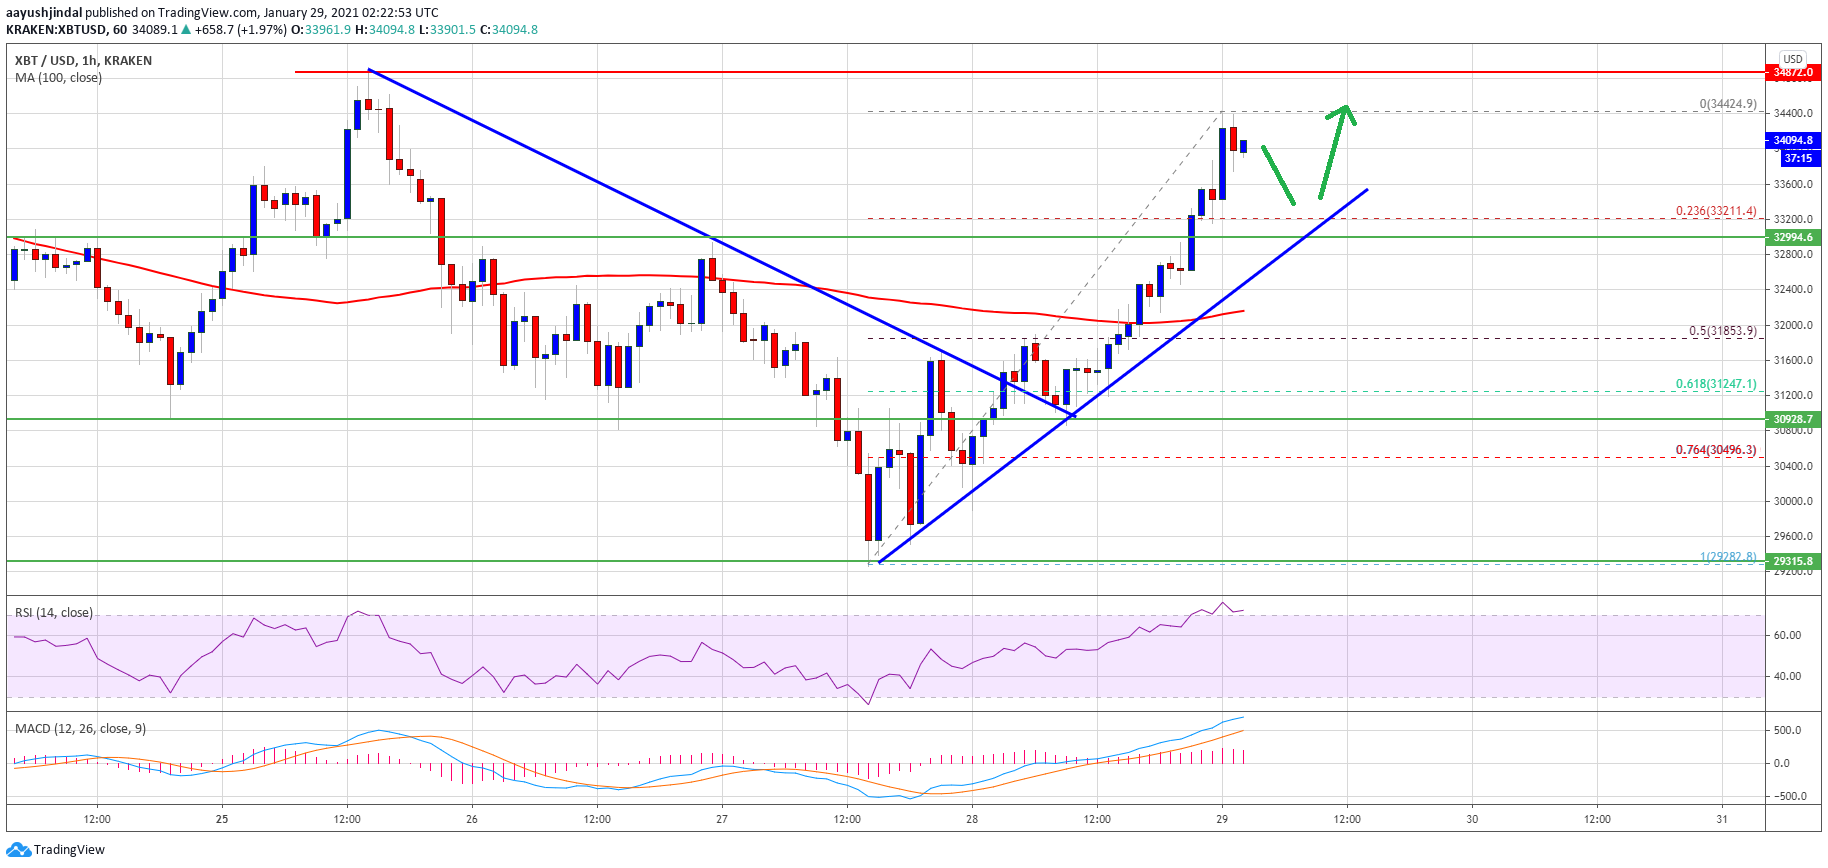
Source: BTCUSD on TradingView.com
There is also a major bullish trend line forming with support near $33,200 on the same chart. On the upside, the price is facing a lot of strong hurdles near $34,500 and $35,000.
To move into a positive zone for a larger rally, bitcoin must break the $34,500 resistance and then settle above the key $35,000 barrier in the near term.
Fresh Dip in BTC?
If bitcoin fails to clear the $34,500 resistance or $35,000, it could start a fresh decline. An initial support is near the trend line at $33,200.
The main support is now forming near the $32,000 zone. It is close to the 100 hourly simple moving average, and the 50% Fib retracement level of the upward move from the $29,282 swing low to $34,424 high. Any more losses may possibly call for a test of $31,200.
Technical indicators:
Hourly MACD – The MACD is slowly losing pace in the bullish zone.
Hourly RSI (Relative Strength Index) – The RSI for BTC/USD is now well above the 60 level.
Major Support Levels – $33,200, followed by $32,000.
Major Resistance Levels – $34,500, $34,800 and $35,000.