
Bitcoin price extended its decline towards the $17,650 level before correcting higher against the US Dollar. BTC is now facing hurdles near $18,600 (the previous key support).
- Bitcoin is facing hurdles near the previous support at $18,500 and $18,600.
- The price is still well below the $19,000 pivot level and the 100 hourly simple moving average.
- There is a key bearish trend line forming with resistance near $18,560 on the hourly chart of the BTC/USD pair (data feed from Kraken).
- The pair must break the $18,500 and $18,600 resistance levels to continue higher.
Bitcoin Price is Facing Hurdles
Yesterday, we saw a sharp decline in bitcoin price below the $18,500 support level. BTC even extended its decline below the $18,000 support and settled below the 100 hourly simple moving average.
The decline gained pace below $18,000 and the price traded close to the $17,650 level. A low was formed near $17,644 and there was a strong recovery wave. The price climbed back above the $18,000 and $18,200 levels.
However, bitcoin struggled to clear the $18,600 resistance zone (the last key breakdown zone). A high is formed near $18,639 and the price is currently showing a few bearish signs. It is trading near the 23.6% Fib retracement level of the recent recovery from the $17,644 low to $18,639 high.
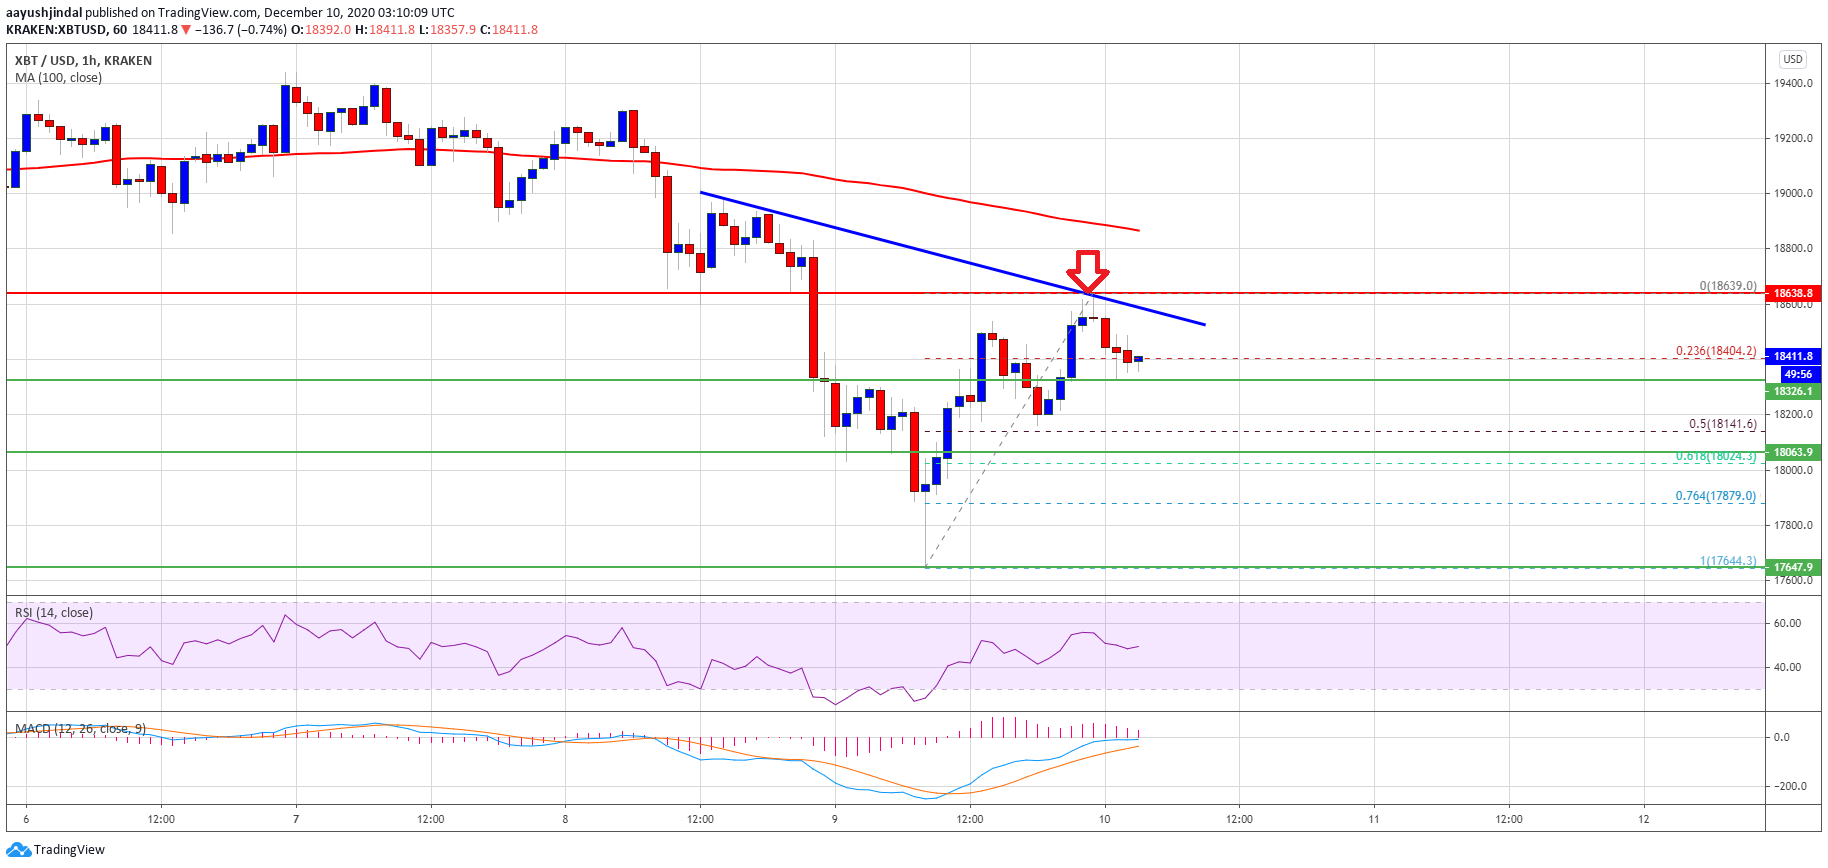
Source: BTCUSD on TradingView.com
The next major support is near the $18,150 level. It is close to the 50% Fib retracement level of the recent recovery from the $17,644 low to $18,639 high.
On the upside, the price is facing hurdles near the previous support at $18,500 and $18,600. There is also a key bearish trend line forming with resistance near $18,560 on the hourly chart of the BTC/USD pair. A clear break above the $18,500 and $18,600 resistance levels could open the doors for a push towards the $19,000 level.
Fresh Drop in BTC?
If bitcoin fails to clear the $18,600 resistance zone, it could resume its decline. An initial support is near the $18,150 and $18,100 levels.
The first key support is near $18,000, below which the price might drop towards the $17,644 swing low. Any more losses might lead the price towards the $17,400 level.
Technical indicators:
Hourly MACD – The MACD is struggling to gain pace in the bullish zone.
Hourly RSI (Relative Strength Index) – The RSI for BTC/USD is currently just above the 50 level.
Major Support Levels – $18,150, followed by $18,000.
Major Resistance Levels – $18,500, $18,600 and $18,800.