
Bitcoin price extended its rise and it even tested the $58,000 resistance against the US Dollar. BTC is showing positive signs and it is likely to accelerate higher above $60,000.
- Bitcoin remains in a bullish zone and it even climbed above the $58,000 resistance.
- The price is now trading well above $56,000 and the 100 hourly simple moving average.
- There are two bullish trend lines forming with support near $55,650 and $55,000 on the hourly chart of the BTC/USD pair (data feed from Kraken).
- The pair could correct lower, but the bulls are likely to remain active above $55,000.
Bitcoin Price is Gaining Momentum
After a close above the $55,000 resistance, bitcoin extended its rise above $56,000. BTC settled nicely above the $55,000 level and the 100 hourly simple moving average.
It opened the doors for a push above the $57,000 and $57,500 resistance levels. The price even spiked above the $58,000 resistance and traded to a new monthly high at $58,140. It is now correcting lower and trading below the $58,000 level.
There was a break below the 23.6% Fib retracement level of the recent increase from the $54,318 swing low to $58,140 high. On the downside, there are two bullish trend lines forming with support near $55,650 and $55,000 on the hourly chart of the BTC/USD pair.
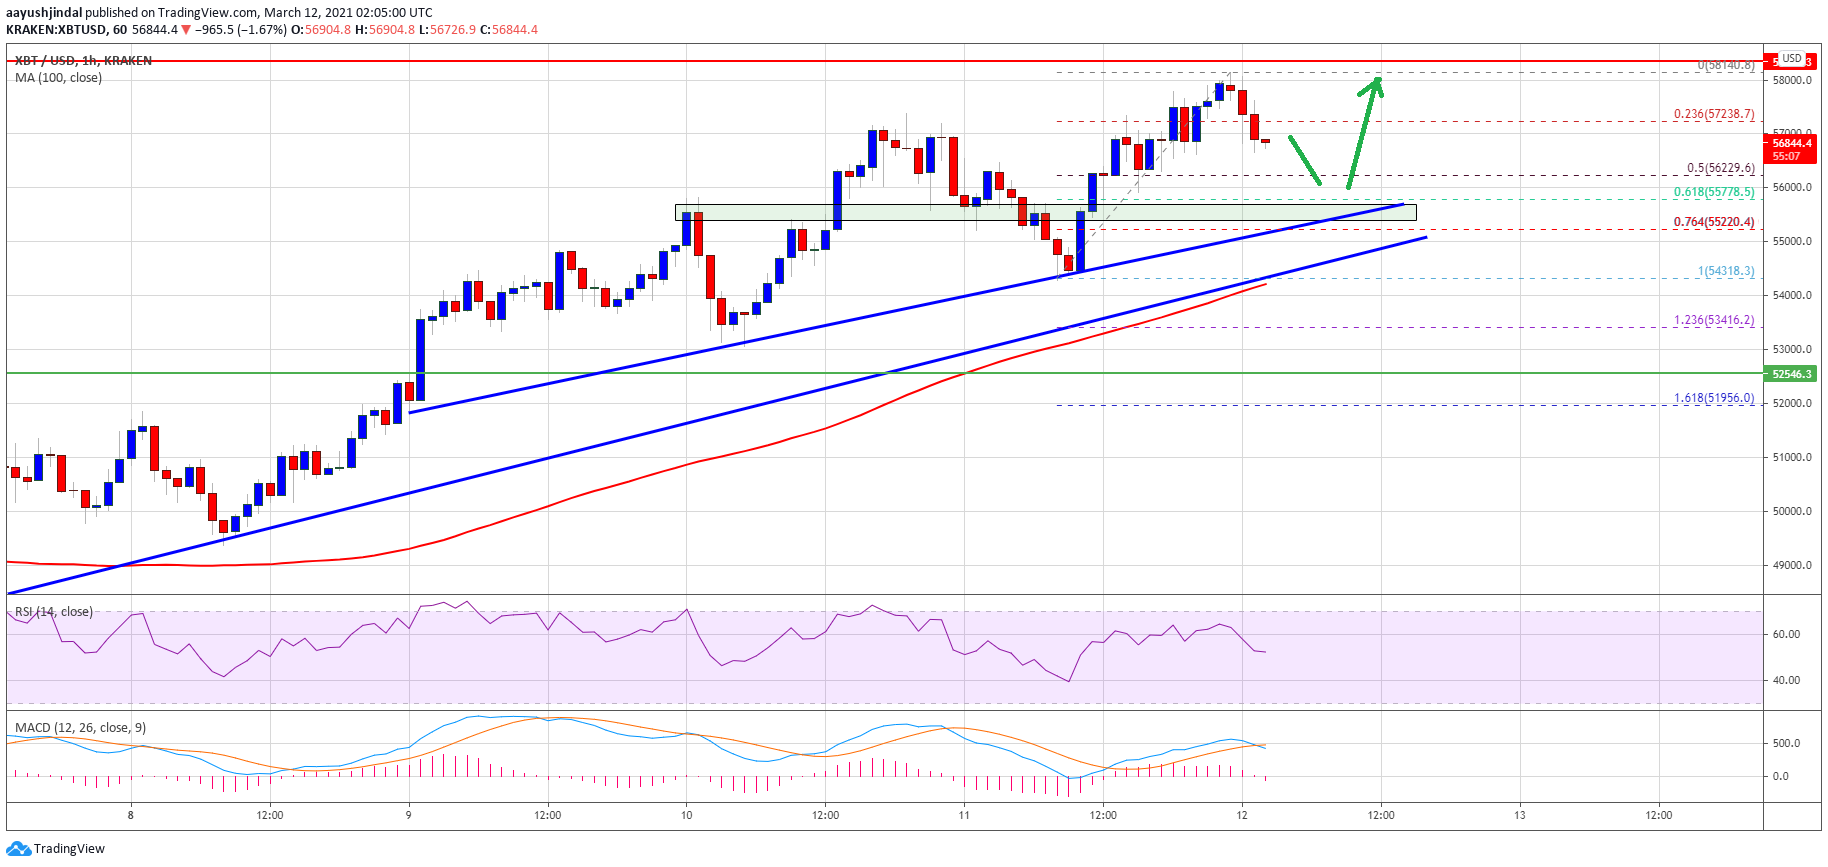
Source: BTCUSD on TradingView.com
On the upside, the price is likely to face sellers near the $58,000 zone. A clear close above the $58,000 resistance will most likely start a strong increase. The next target for the bulls could be $60,000 in the near term. Any more gains could lead the price towards the $62,000 level.
Dips Supported in BTC?
If bitcoin fails to clear the $58,000 resistance, it could correct lower. The first key support is near the $56,200 level. It is close to the 50% Fib retracement level of the recent increase from the $54,318 swing low to $58,140 high.
The main support is near the trend line and $55,500. Any more losses might call for a test of the $55,000 support level. If the bulls fail to defend the $55,000 support zone, the price is likely to dive towards the $52,000 support in the coming sessions.
Technical indicators:
Hourly MACD – The MACD is slowly losing momentum in the bullish zone.
Hourly RSI (Relative Strength Index) – The RSI for BTC/USD is declining towards the 50 level.
Major Support Levels – $55,650, followed by $55,000.
Major Resistance Levels – $58,000, $58,500 and $60,000.