
Bitcoin price is still trading in a broad range below the $19,500 resistance against the US Dollar. BTC must gain strength above $19,500 to start a fresh rally in the near term.
- Bitcoin is facing a strong resistance near the $19,500 and $19,580 levels.
- The price is currently trading above the $19,000 support and the 100 hourly simple moving average.
- There is a new important bearish trend line forming with resistance at $19,350 on the hourly chart of the BTC/USD pair (data feed from Kraken).
- The pair is likely to remain in a range, with high chances of an upside break above $19,500.
Bitcoin Price is Facing Hurdles
In the past few days, there were mostly range moves in bitcoin price below $19,500 and $19,600. BTC made a couple of attempt to gain strength above $19,400, but it failed to extend its rise.
The recent high was formed near $19,407 before the price moved lower in a range. A low is formed near $18,889 before the price corrected higher. It broke the 50% Fib retracement level of the recent decline from the $19,407 high to $18,889 low.
Bitcoin is now trading above the $19,000 support and the 100 hourly simple moving average. It is also testing the 61.8% Fib retracement level of the recent decline from the $19,407 high to $18,889 low.
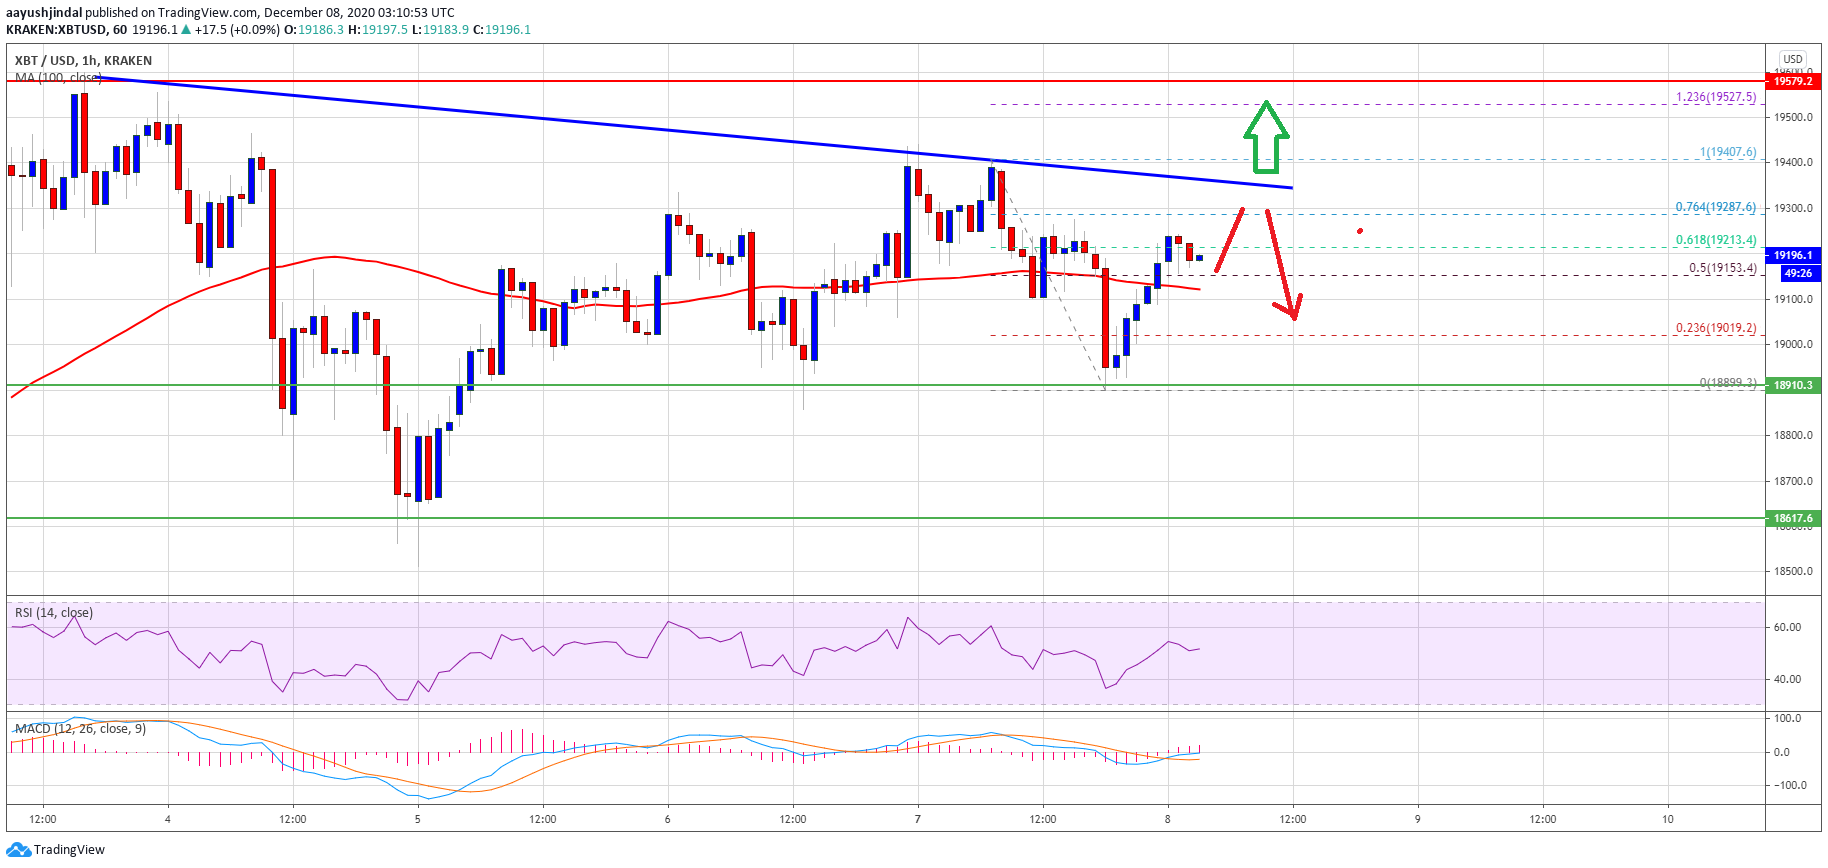
An initial resistance is near the $19,280 level. There is also a new important bearish trend line forming with resistance at $19,350 on the hourly chart of the BTC/USD pair. A clear break above the trend line resistance could lead the price towards the main $19,500 resistance zone. To gain bullish momentum, the price must close above $19,500 and clear $19,580.
Bearish Wave in BTC?
If bitcoin fails to clear the $19,350 resistance zone, it could react to the downside. An initial support is near the $19,100 level and the 100 hourly simple moving average.
The first major support is near $19,000, followed by the $18,900 level. Any more losses might increase pressure on the bulls and the price might decline towards $18,500 in the near term.
Technical indicators:
Hourly MACD – The MACD is struggling to gain momentum in the bullish zone.
Hourly RSI (Relative Strength Index) – The RSI for BTC/USD is currently sliding and it is just below the 50 level.
Major Support Levels – $19,000, followed by $18,900.
Major Resistance Levels – $19,350, $19,500 and $19,580.