
Bitcoin price started a strong surge above the $42,000 resistance against the US Dollar. BTC traded to a new all-time high near $47,500 and it remains supported for more gains.
- Bitcoin started a strong increase above the $40,000 and $42,000 resistance levels.
- The price is now well above $45,000 and the 100 hourly simple moving average.
- There was a break above a bullish continuation pattern with resistance near $43,500 on the hourly chart of the BTC/USD pair (data feed from Kraken).
- The pair is likely to continue higher towards the $48,000 and $50,000 levels in the near term.
Bitcoin Price is Gaining Bullish Momentum
After the report highlighting Tesla’s bitcoin holding, bitcoin price started a strong surge above the $42,000 resistance. BTC rallied over 20% and it broke many hurdles on the way up.
After hitting $44,500, there was a minor consolidating. Finally, there was a break above a bullish continuation pattern with resistance near $43,500 on the hourly chart of the BTC/USD pair. The pair climbed further higher above the $45,000 and $46,000 levels.
The price traded to a new all-time high near $47,513 before it started a downside correction. There was a break below the $46,500 level. Bitcoin corrected below the 23.6% Fib retracement level recent rally from the $42,528 swing low to $47,513 high.
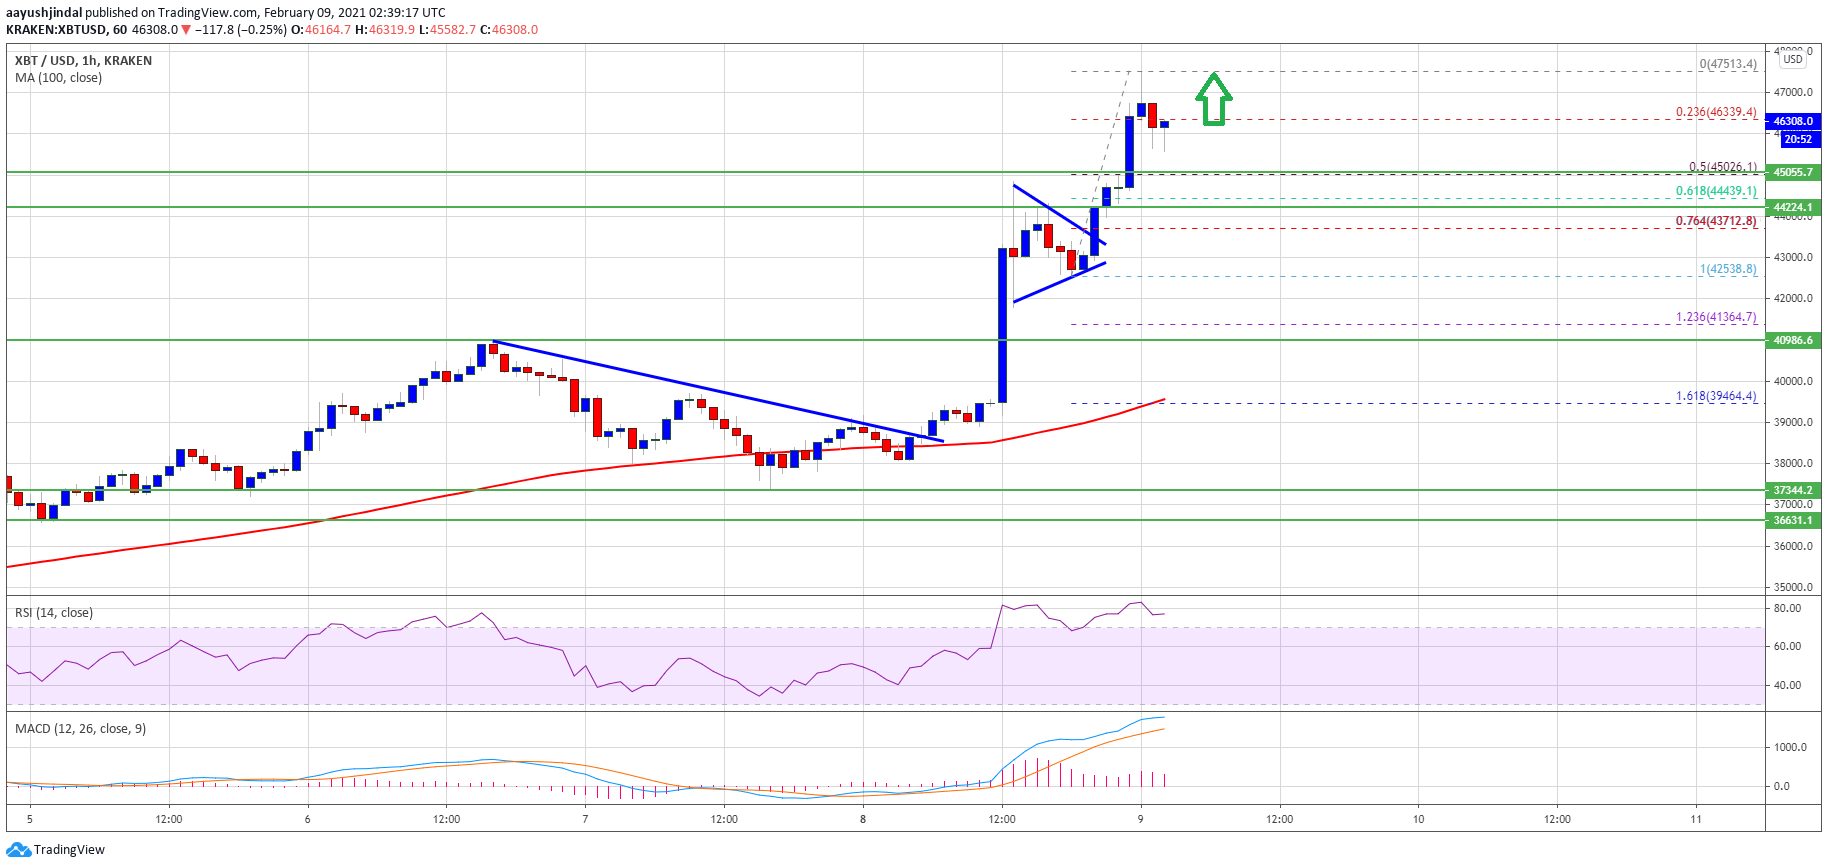
Source: BTCUSD on TradingView.com
It is now well above $45,000 and the 100 hourly simple moving average. The next key support is near the $45,000 level. It is close to the 50% Fib retracement level recent rally from the $42,528 swing low to $47,513 high.
On the upside, a break above the $47,500 zone could open the doors for more gains. The next target could be $48,500, but the bulls might aim a test of the $50,000 level in the near term.
Dips Supported in BTC?
If bitcoin fails to continue higher, it could correct lower towards the $45,500 and $45,000 levels. The next major support is near the $44,250 level (the recent breakout zone).
Any more losses below the $45,000 and $44,250 support levels could spark a downside extension. In the stated case, the price might dip towards the $42,000 support.
Technical indicators:
Hourly MACD – The MACD is gaining momentum in the bullish zone.
Hourly RSI (Relative Strength Index) – The RSI for BTC/USD is still in the overbought zone.
Major Support Levels – $45,000, followed by $44,250.
Major Resistance Levels – $47,500, $48,000 and $50,000.