
Chainlink (LINK) is trading nicely above the $14.00 support zone against the US Dollar. It seems like the bulls are setting up for another rally if the price clears the $16.00 resistance.
- Chainlink token price is trading above the main $14.00 support zone against the US dollar.
- The bulls are facing a major resistance near the $16.00 level and 100 simple moving average (4-hours).
- There is a crucial contracting triangle forming with resistance near $16.00 on the 4-hours chart of the LINK/USD pair (data source from Kraken).
- The pair is likely to start a fresh rally once it clears the $16.00 resistance zone.
Chainlink (LINK) Holding Uptrend Support
After a major downside correction, chainlink (LINK) found support above the $12.50 level against the US Dollar. LINK formed a decent support base above the $14.00 level and started consolidating losses in a broad range below the 100 simple moving average (4-hours).
The recent low was near $13.39 before the price started moving higher. It surpassed the $14.50 and $14.80 resistance levels. There was also a break above the 50% Fib retracement level of the downward move from the $16.38 high to $13.39 low.
LINK is currently facing a strong resistance near the $15.65 level and the 100 simple moving average (4-hours). The 76.4% Fib retracement level of the downward move from the $16.38 high to $13.39 low is also acting as a resistance.
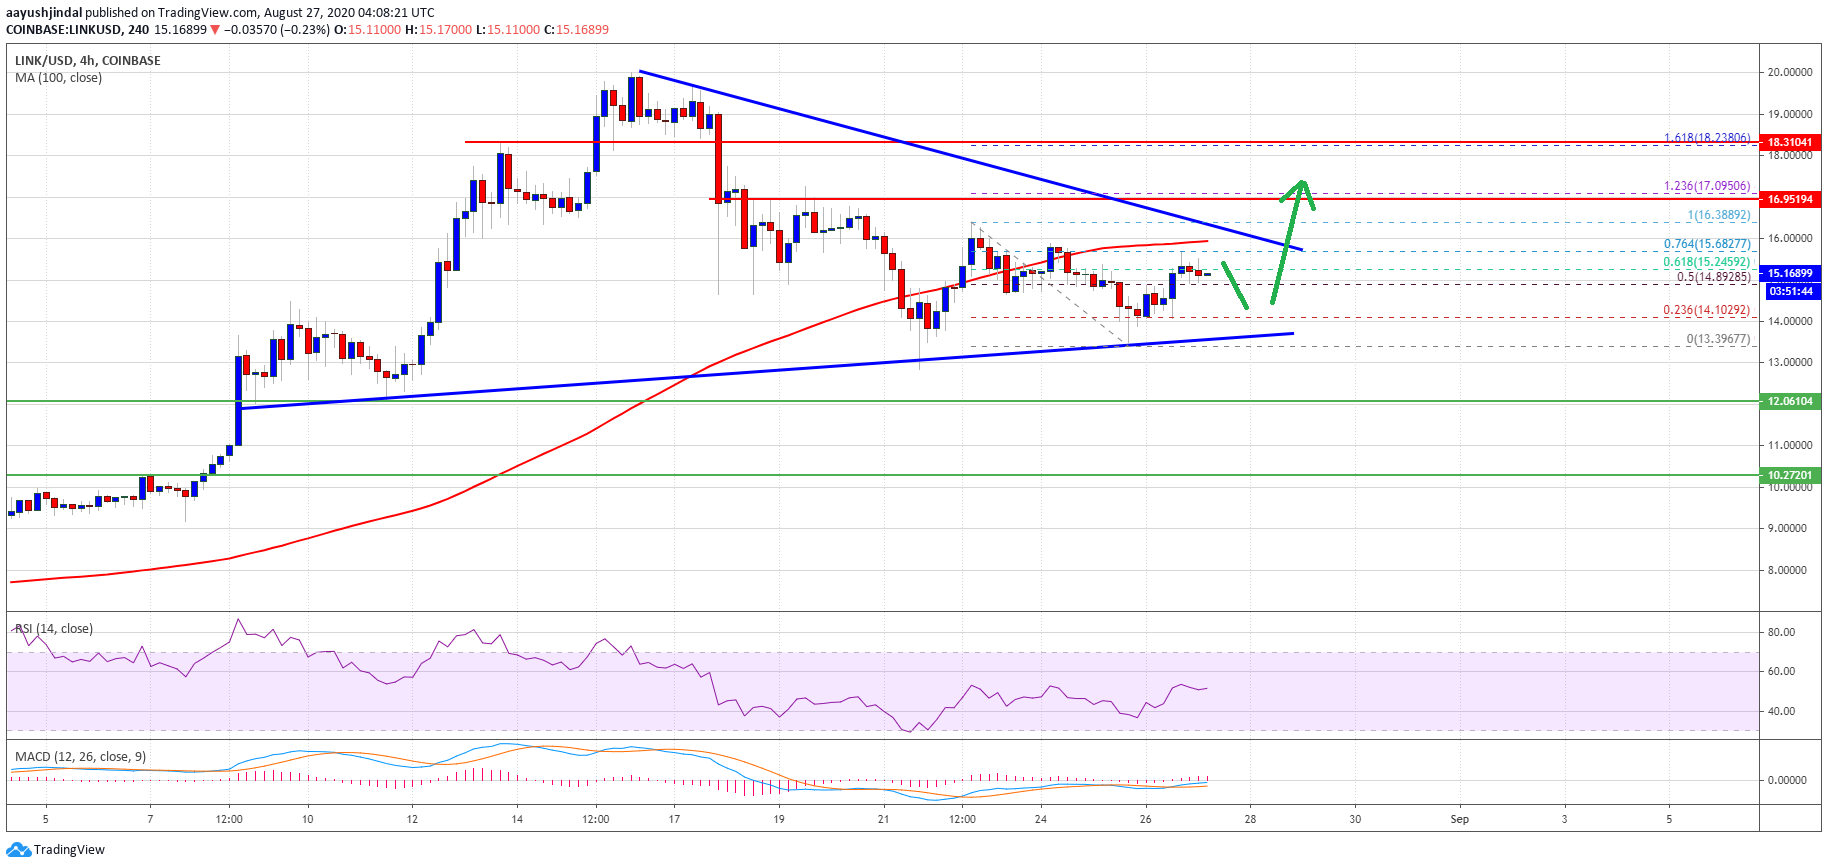
LINK price above $15.00. Source: TradingView.com
More importantly, there is a crucial contracting triangle forming with resistance near $16.00 on the 4-hours chart of the LINK/USD pair. A successful break above the 100 SMA and the trend line at $16.00 could open the doors for a fresh rally.
The next key resistance is near the $16.95 level, above which chainlink (LINK) might rise steadily towards the $17.50 and $18.00 levels in the near term.
Dips Likely to be Limited
On the downside, chainlink’s price is likely to find strong bids near the triangle support and $14.00. The next major support is near the $13.00 level.
A downside break below the $13.00 support level could push the price towards the breakdown support at $12.00. Any further losses may perhaps lead the price towards the $10.00 handle.
Technical Indicators
4-hours MACD – The MACD for LINK/USD is slowly gaining pace in the bullish zone.
4-hours RSI (Relative Strength Index) – The RSI for LINK/USD is now moving nicely above the 50 level.
Major Support Levels – $14.00, $13.00 and $12.00.
Major Resistance Levels – $15.65, $16.00 and $16.95.