
Chainlink (LINK) is holding the key $12.50 support level, similar to bitcoin at $18,500. The price is likely to start a strong increase above $13.50 as long as it is above $12.50.
- Chainlink token price is consolidating above the key $12.50 support against the US dollar.
- The price is now facing hurdles near $13.50 and the 100 simple moving average (4-hours).
- There is a key contracting triangle forming with resistance near $13.50 on the 4-hours chart of the LINK/USD pair (data source from Kraken).
- The price is likely to break above $13.50 unless there is a clear break below $12.50.
Chainlink (LINK) Could Rally above $13.5
In the past few sessions, there were mostly range moves in bitcoin, Ethereum, ripple bitcoin cash, chainlink (LINK), and other major altcoins. LINK price started a short-term downside correction after it failed to stay above $14.00.
A high was formed near $14.25 before the price declined below $13.50 and $13.00. However, the bulls protected the main $12.50 support area. A low is formed near $12.50 and the price is currently rising. There was a break above the $13.00 level.
The price even spiked above the 50% Fib retracement level of the recent drop from the $14.25 swing high to $12.50 swing low. It is now facing hurdles near $13.50 and the 100 simple moving average (4-hours).
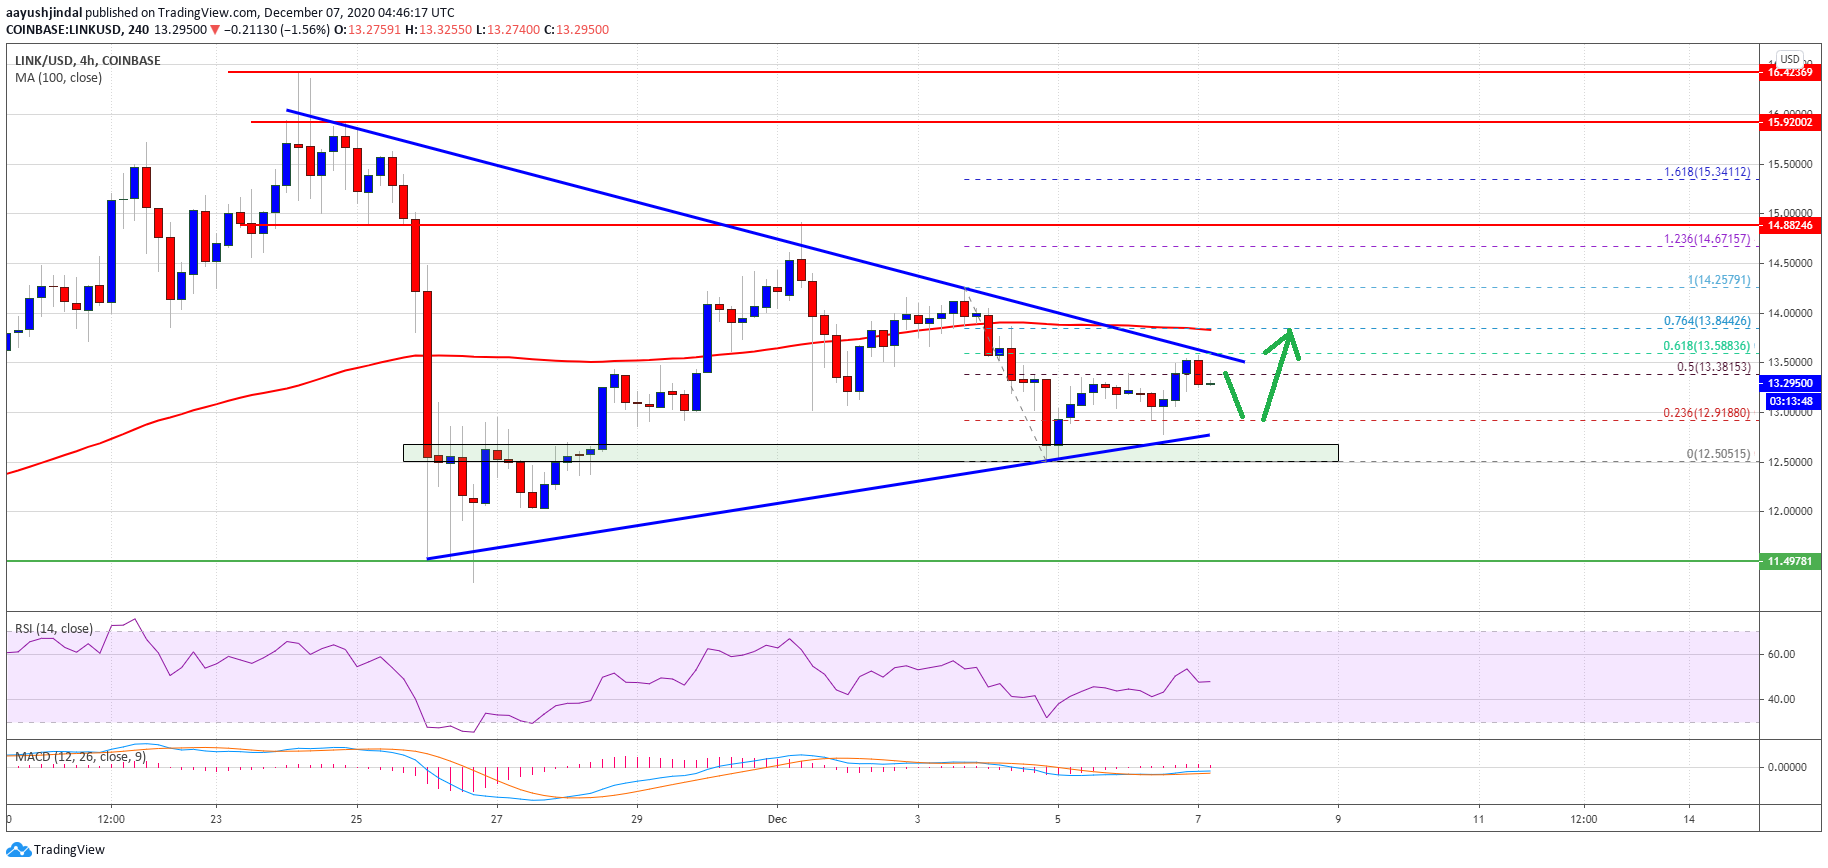
Source: LINKUSD on TradingView.com
There is also a key contracting triangle forming with resistance near $13.50 on the 4-hours chart of the LINK/USD pair. The triangle resistance coincides with the 61.8% Fib retracement level of the recent drop from the $14.25 swing high to $12.50 swing low.
A clear break above the $13.50 resistance zone might increase the chances of a sharp upward move above $14.00. The next key resistance is at $14.25, above which the price might rise towards $15.50 and $16.20.
Downsides Supported?
An initial support for chainlink’s price is near the $13.05 and $13.0 levels. The first major support is forming near the $12.80 level and the triangle lower trend line.
If there is a downside break and close below the triangle support zone, the price could revisit $12.50. Any more losses may possibly start a strong downward move below $12.00 and $11.80.
Technical Indicators
4-hours MACD – The MACD for LINK/USD is struggling to gain momentum in the bullish zone.
4-hours RSI (Relative Strength Index) – The RSI for LINK/USD is currently close to the 50 level.
Major Support Levels – $13.00, $12.80 and $12.50.
Major Resistance Levels – $13.50, $13.80 and $15.00.