
Advertisement
Long-Term Outlook
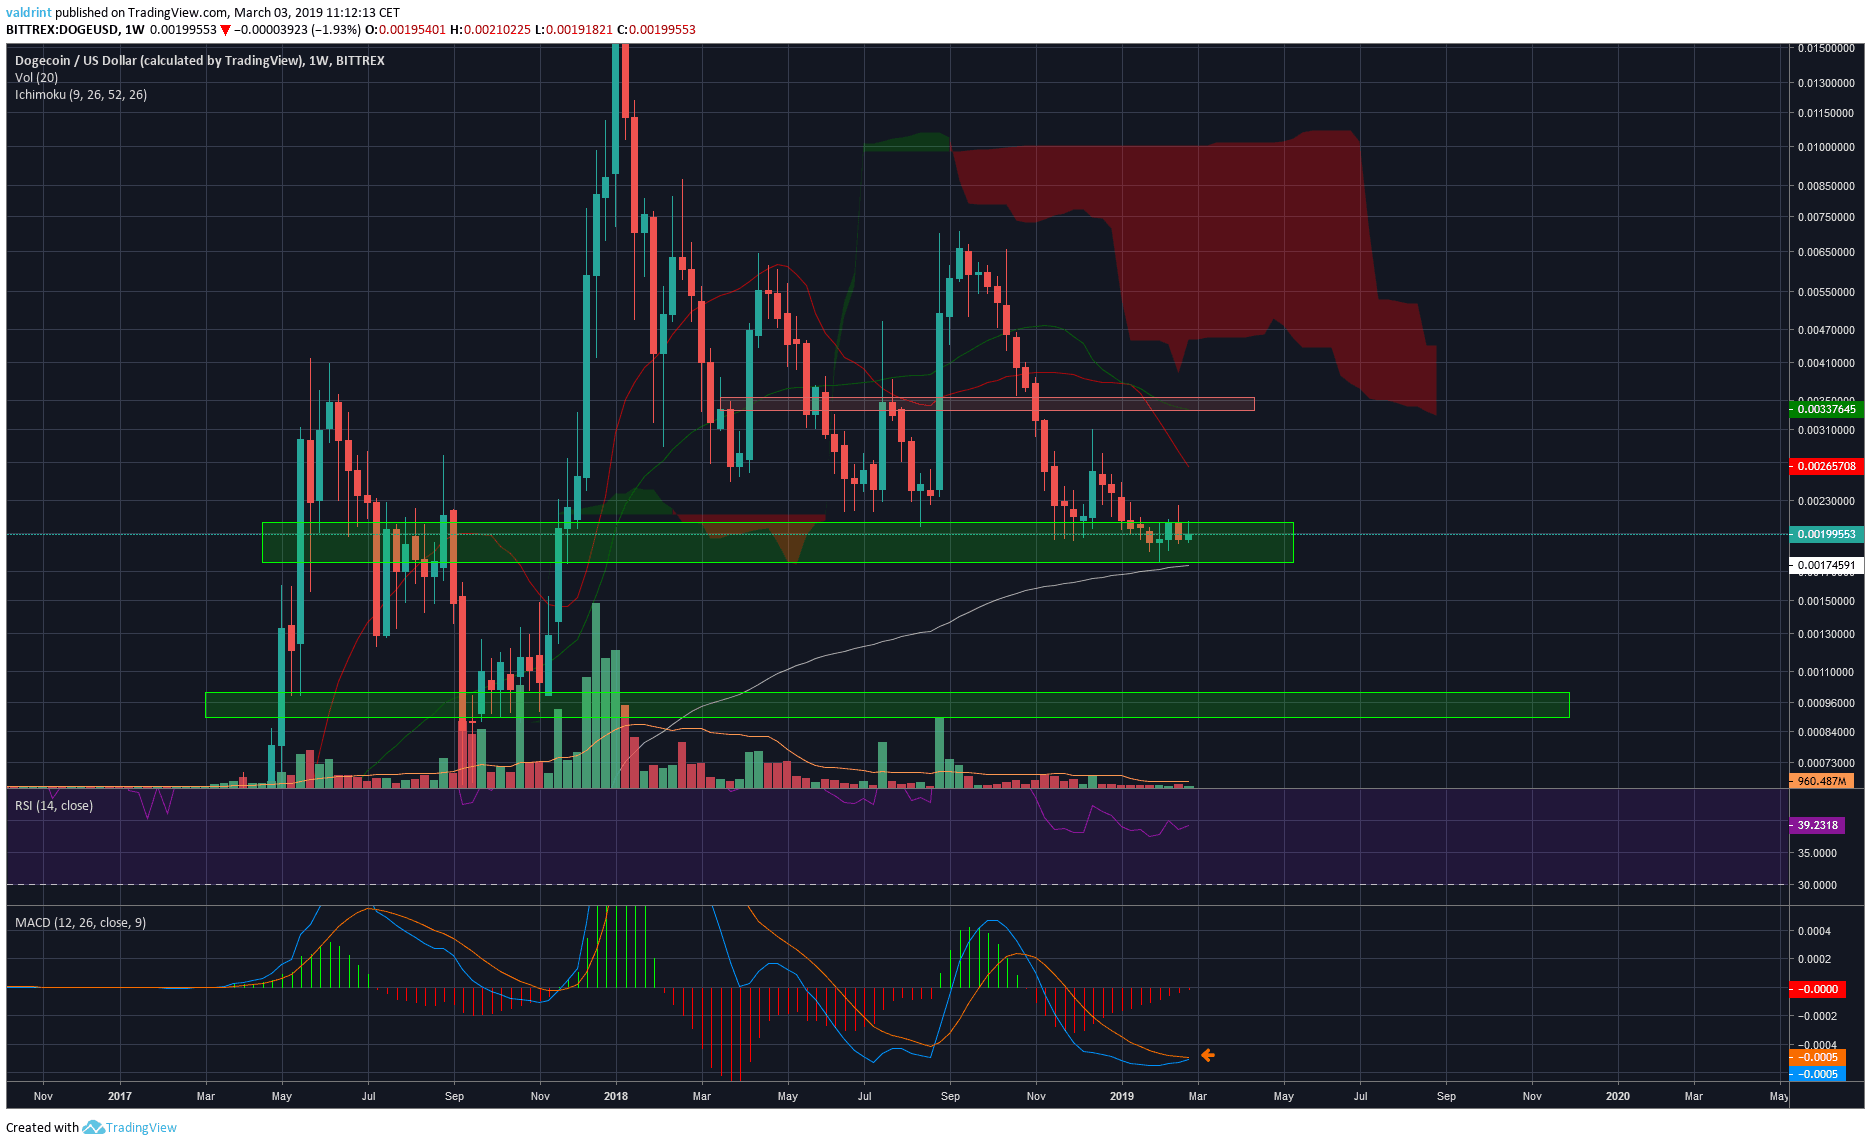
A look at the Weekly chart for Dogecoin shows that price is trading inside the major support area near $0.0019 formed by previous lows and has found support right above the 200-period MA.
However, the price is trading below all the other MAs and the negative Ichimoku cloud.
Advertisement
After rejecting a bullish cross in January 2019, the 21-period MA started to fall sharply.
The RSI is at 39, indicating neither overbought nor oversold conditions.
In a more positive note, the MACD is very close to making a bullish cross for the first time in almost a year.
Medium-Term Outlook
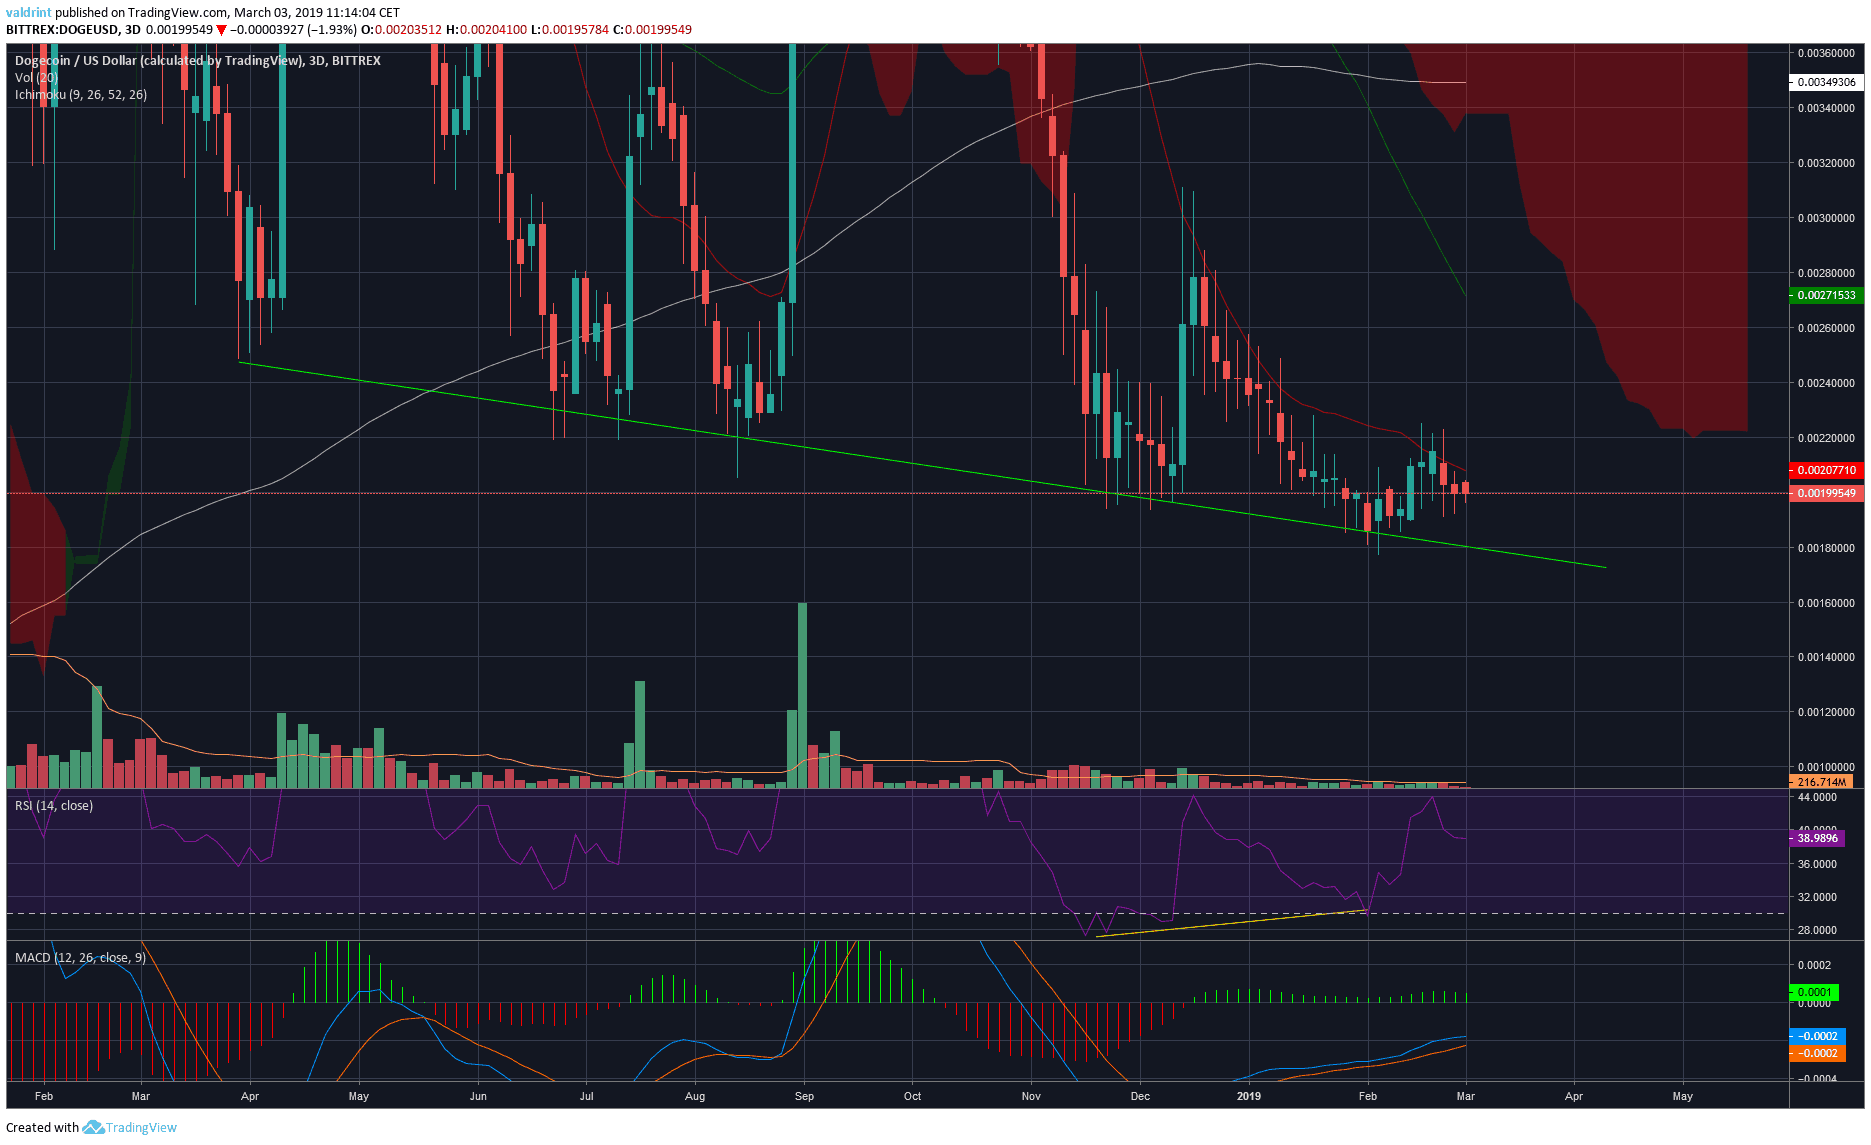 Dogecoin 3-Day Chart
A look at the 3-day chart gives us a trading structure.
We can see that price has been following a descending support line since April 2018.
Furthermore, the price has started to generate bullish divergence in both the RSI and the MACD, the latter of which is moving upward after making a bullish cross but is not positive yet.
However, the price is trading below all the moving averages and facing very close resistance form the 21-period MA.
Most candles have had upper and lower wicks, showing indecision in the market.
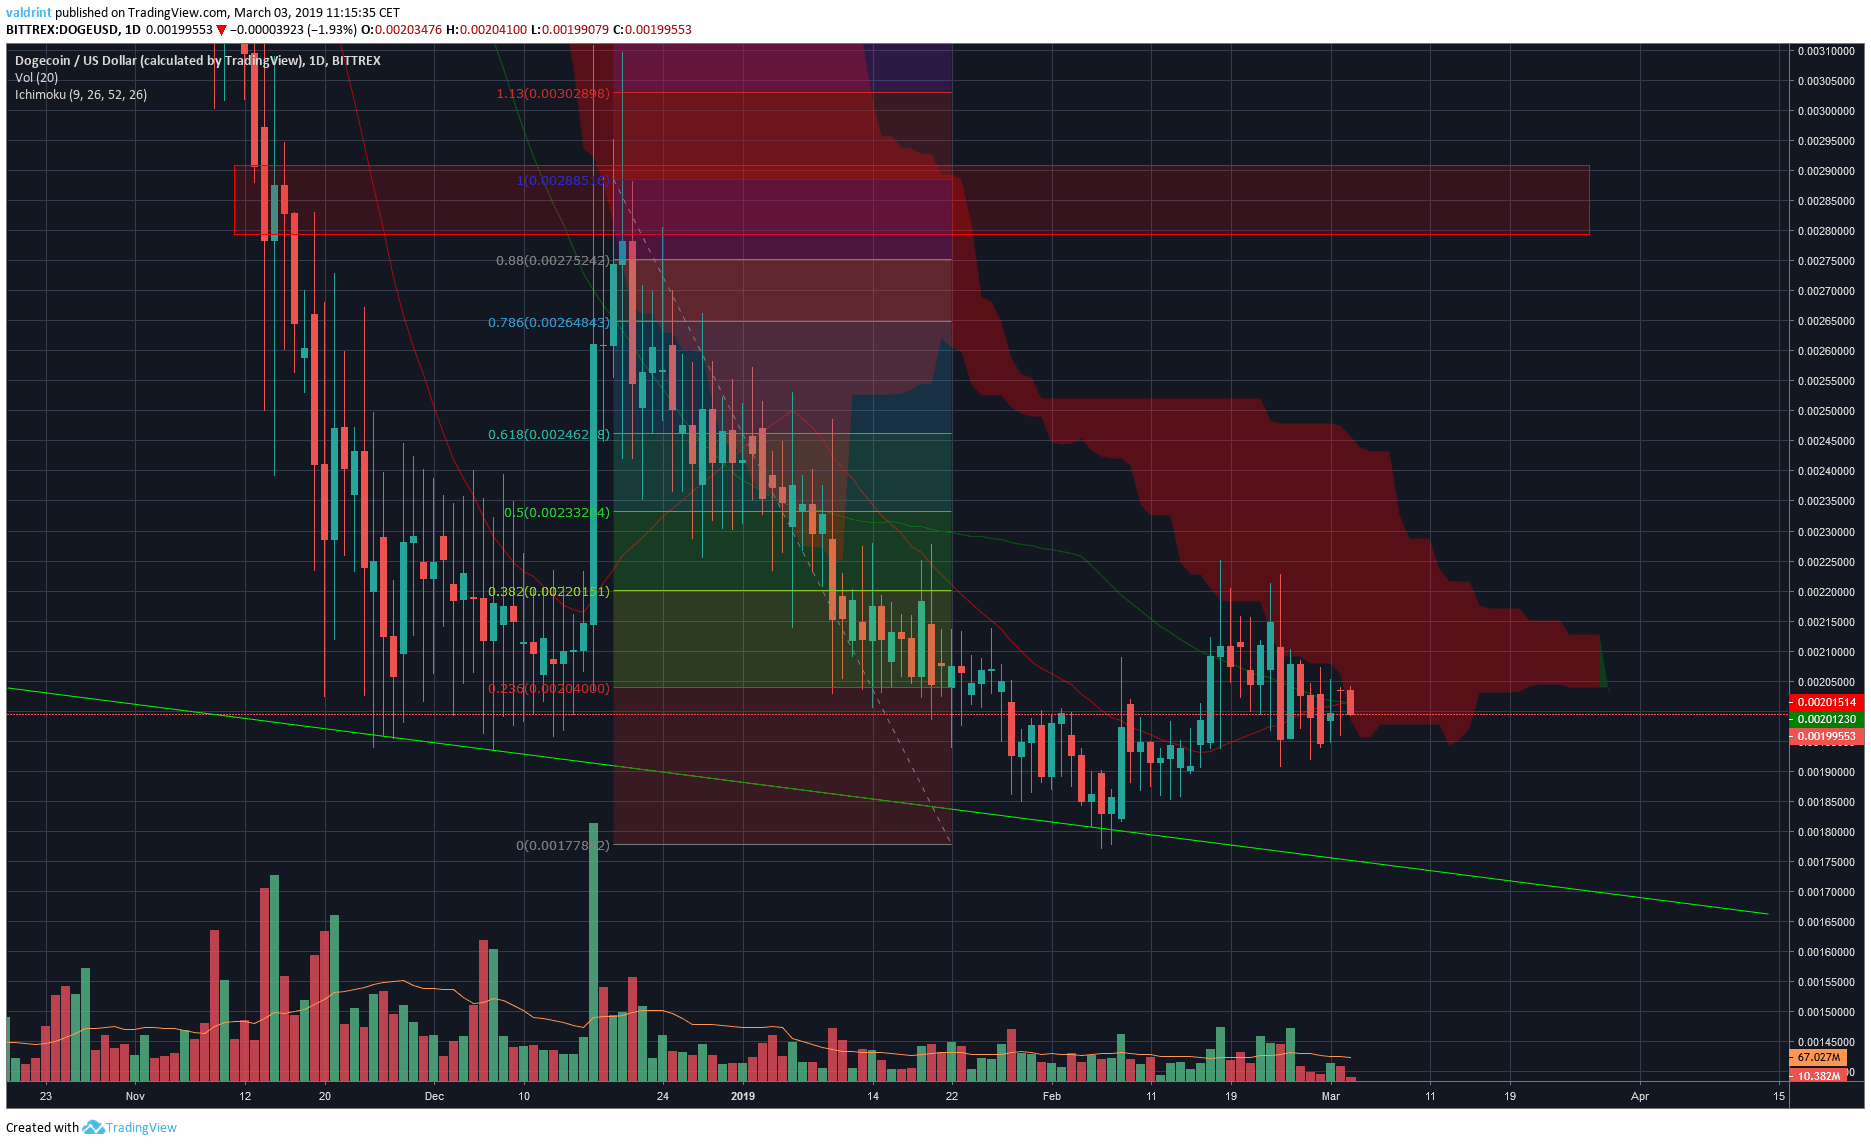 Dogecoin Daily Chart
A look at the Daily chart shows that after the drop, the price has struggled to break above $0.002, coinciding with the 0.382 fib line of the entire drop.
Also, the price is facing very close resistance from the edge of the Ichimoku cloud.
Finally, the 21 and 50-period moving averages are very close to making or rejecting a bullish cross and are trading in line with the price.
Short-Term Outlook and Price Prediction
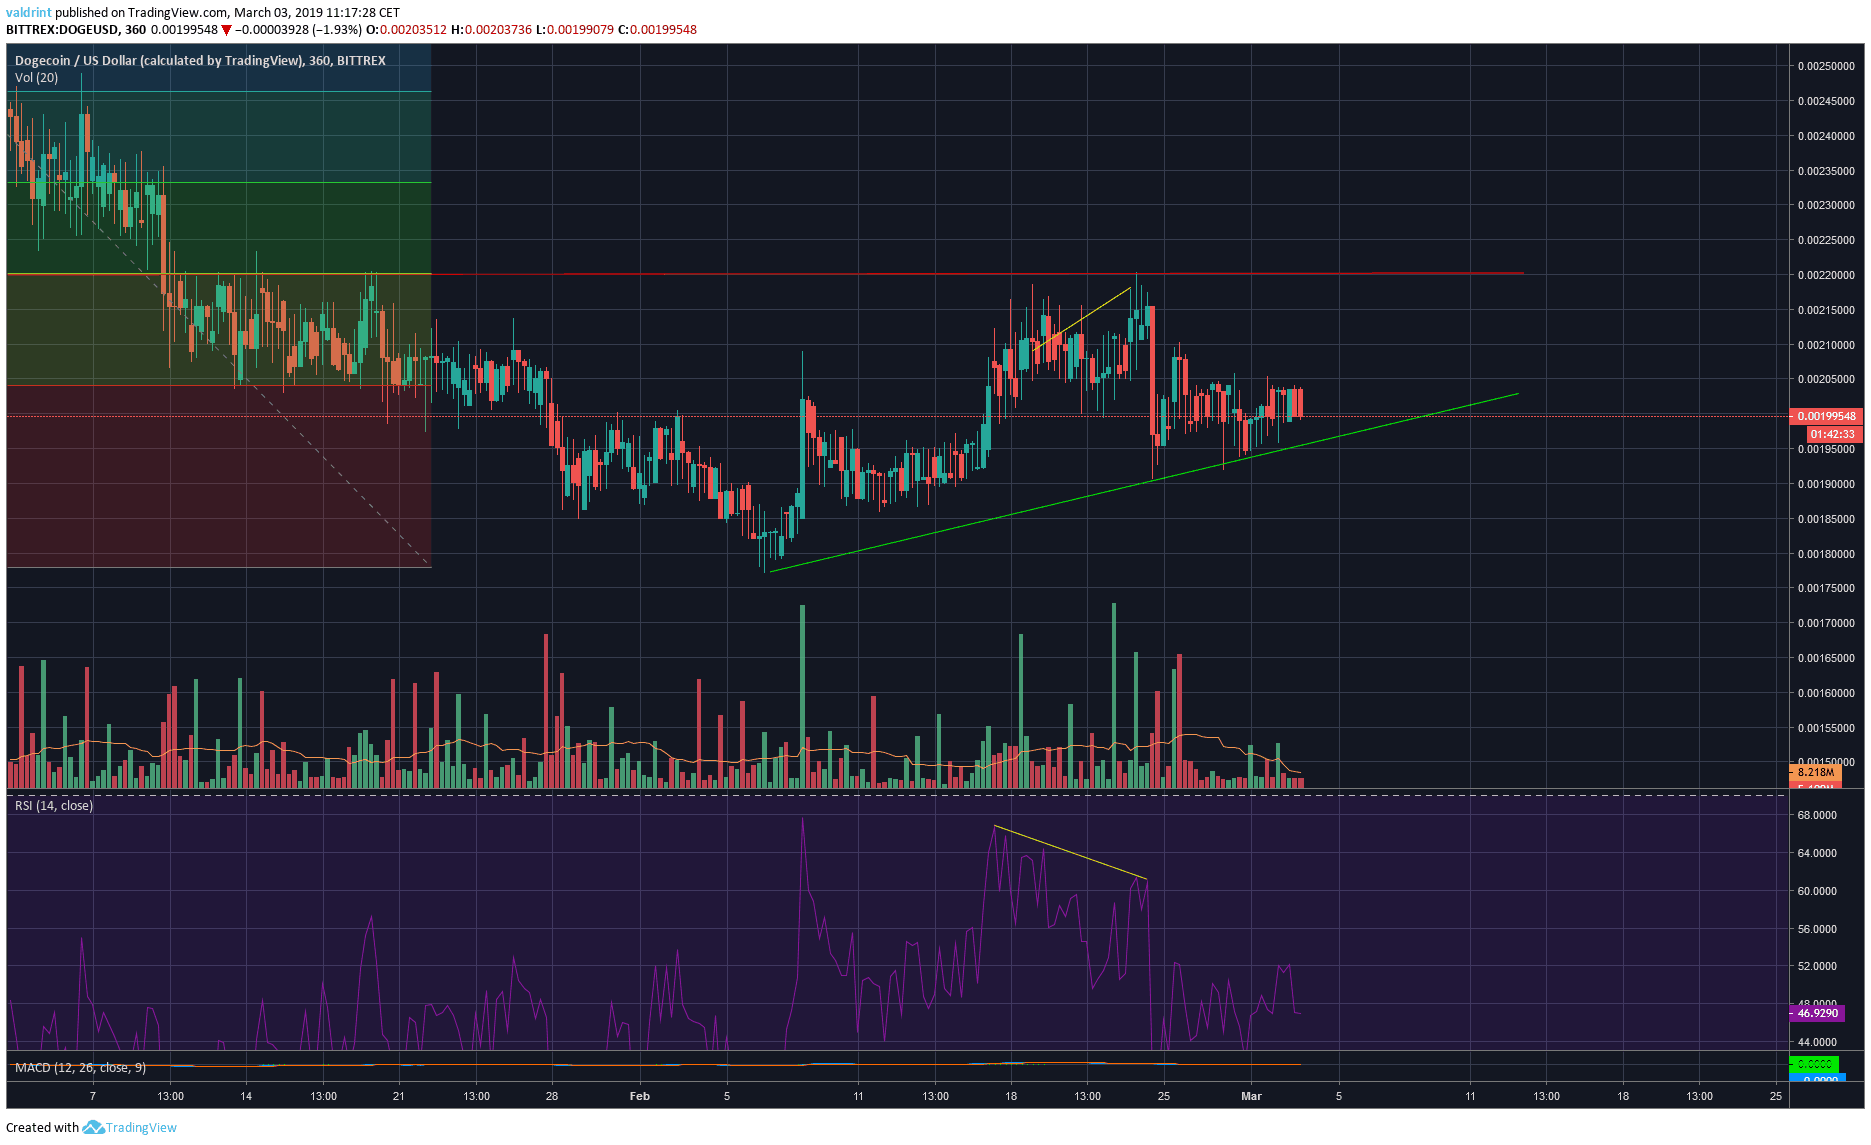 Dogecoin 6-Hour Chart
A look at the 6-hour chart shows that the drop was preceded by bearish divergence in the RSI.
Furthermore, we have a trading structure.
Price is trading inside a symmetrical triangle and has been doing so since February the 5th.
The upper resistance of the triangle is provided by the 0.382 fib line.
The triangle is projected to end on March 15th.
Price Prediction: I believe that during next week the price will move to the top of the triangle at $0.00225
Conclusions
- The price is trading inside a major support area.
- There is a medium-term bullish divergence.
- The price is trading inside a short-term symmetrical triangle.
RELATED ARTICLES
MORE FROM OUR PARTNERS
Advertisement
blokt.com is author of this content, TheBitcoinNews.com is is not responsible for the content of external sites.
source: https://blokt.com/technical-analysis/dogecoin-price-analysis-doge-is-trading-inside-a-symmetrical-triangle-when-will-the-breakout-occur
TheBitcoinNews.com is here for you 24/7 to keep you informed on everything crypto. Like what we do? Tip us some Satoshi with the exciting new Lightning Network Tippin.me tool!