
Much to the chagrin of investors, Bitcoin has formed a close correlation to the traditional markets in recent times that has exposed the cryptocurrency to significant downwards momentum throughout the past several weeks.
Although BTC has been able to post some notable gains in recent times as the benchmark stock indices all stabilize, it is important to note that this stability may soon dissolve.
This may come about due to a highly bearish technical sign that the Dow Jones just flashed for the second time ever, leading some analysts to conclude that major downside is imminent.
If Bitcoin maintains its status as a risk-on asset, this looming decline could prove to be dire.
Bitcoin Runs as Stock Market Stabilizes, But Correlation Remains Strong
Bitcoin has been caught within a firm uptrend in the time following the cryptocurrency’s decline to lows of $3,800 in mid-March.
Yesterday, bulls extended this momentum as they pushed the crypto to its post-February crash highs of $7,800 – marking an over 100% climb from its March lows.
This rally has been enabled by the stability and recent recovery seen by the stock market, with the Dow Jones and S&P 500 both recovering significantly from their recent lows.
Currently, Bitcoin is trading up several percent from where it started the year at $7,200, while the S&P 500 is trading down nearly 14% over a YTD period.
In spite of Bitcoin’s strong performance in recent times, it is important to note that it is still generally correlated to the equities market.
This trend is elucidated while looking at data from research platform Skew, which shows that the cryptocurrency is still closely tracking the stock market in spite of its slight outperformance.
Image Courtesy of Skew
Could a Looming Stock Market Collapse Send BTC Reeling?
For the time being, this correlation isn’t stopping Bitcoin from seeing bullish price action, but it is possible that this will soon come to an end.
One popular analyst on Twitter recently pointed out that the Dow Jones just tapped its 200-day ema for the second time in history. The first time was in 2008, with the visit to this level being followed by a violent downturn.
“12 years of data and only two times did the 200ema act as resistance on the weekly. – 2008 – 2020. If history were to repeat, expecting A LOT more blood,” he explained while pointing to the below chart.
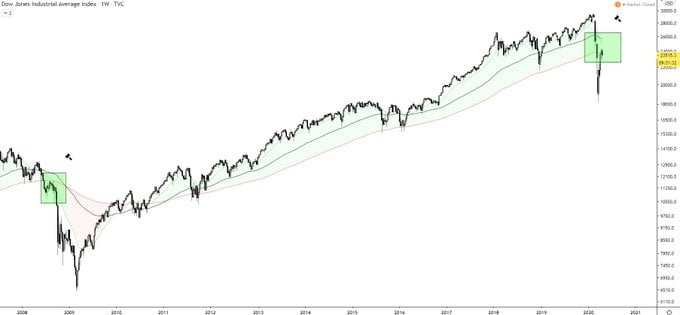
Image Courtesy of Teddy
Unless Bitcoin breaks its status as a risk-on asset and begins firmly decoupling from the traditional markets, it may be on the cusp of another major selloff.
Featured image from Unplash.