When we last discussed the ETH-USD pair, the price was testing support in the mid $200 range.
Since then, the market has dropped another 30% as ether tests the waters in the upper $190 range:
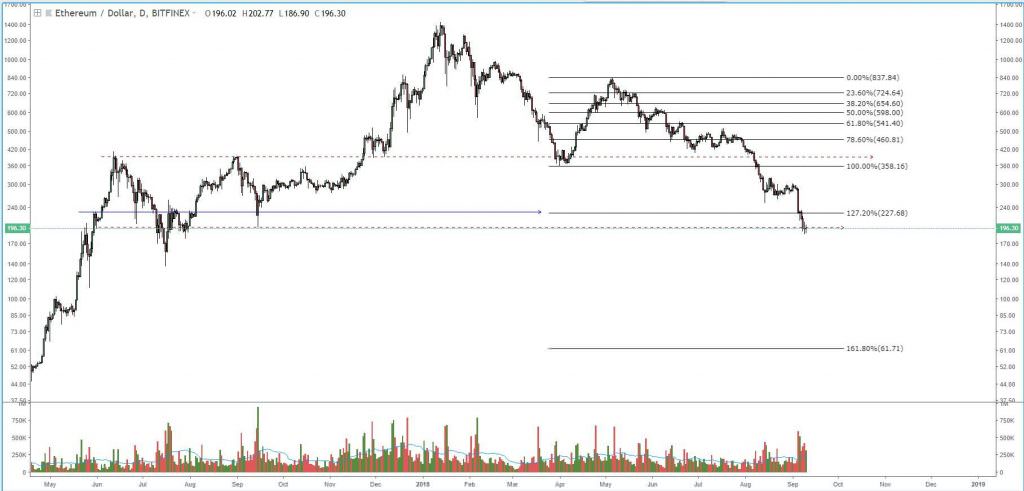
Figure 1: ETH-USD, 1-Day Candles, Macro Trend
The volume on the current drop has been exceptionally high compared to the beginning of its descent from the $800s. However, one thing to note is how little the last few candles have progressed compared to the large amounts of sell volume accompanying the movement — and this actually makes sense on a basic level. Oftentimes, markets love nice round numbers (in our case, $200) and you can clearly see a line of historic support in the $200 range (shown by the red dashed line).
However, something to keep in mind is this humongous bear pennant that ether recently broke out of: Figure 2: ETH-USD, 1-Day Candles, Bear Pennant
This bear pennant has a staggering price target approximately in the $80–$100 range, meaning we are only halfway through its measured move. It should be noted that targets are just targets. Just because a pennant has a price target, that doesn’t mean the full move must be realized.
Currently, the market is testing support on very high volume, which means there is a significant level of supply absorption. At this level, there are some eager bulls buying up the panic sellers. Whether or not their buying pressure will be enough to initiate a rally remains to be seen. Although the current daily candle hasn’t closed, there is a bit of indecision present over the last couple days:
 Figure 3: ETH-USD, Daily Candles, Double Doji Set-up
This candle set-up is called a “double doji”. You can basically think of it as a visual representation of market indecision. This shows us that, even though the intraday volatility was high, the actual deviation between the opening and closing price of the candle was quite low. Although there is indecision, its very possible that the bearish pressure could ultimately win over the bulls, and we could see further capitulation from the long holders. However, this does give the bulls a shot a possible rally.
And, given the extremely high number of open short positions (highest in history, in fact) on Bitfinex, I would say the bulls have a decent shot at a sizeable short squeeze/short covering rally: Figure 4: ETH-USD, Daily Candles, BFX Short Count
Summary:
- ETH-USD has been dropping like a rock over the last few weeks as it managed to realize a 30% devaluation in a very short period of time.
- ETH-USD is testing support at the moment as it sees a bit of market indecision on very high volume.
- With the shorts stacked at all-time high values, it is very possible that we could see a sizeable short squeeze if the buying pressure manages to overwhelm the sellers at this price level.
Trading and investing in digital assets like bitcoin and ether is highly speculative and comes with many risks. This analysis is for informational purposes and should not be considered investment advice. Statements and financial information on Bitcoin Magazine and BTC Media related sites do not necessarily reflect the opinion of BTC Media and should not be construed as an endorsement or recommendation to buy, sell or hold. Past performance is not necessarily indicative of future results.