
Since the beginning of the month, Ethereum has been consolidating within a narrow range. Its price has been mostly contained between the $372 support and the $445 resistance level, without providing any clear signals of where it is headed next.
The stagnant price action caused the Bollinger bands to squeeze within the same time frame, indicating that a period of high volatility is underway. Only a daily candlestick close above $445 or below $372 will determine the direction of Ether’s trend. Until then, this price range can be considered a reasonable no-trade zone.
ETH Sits In No-Trade Zone. (Source: TradingView)
Despite the ambiguity that Ethereum presents, different on-chain metrics suggest that the uptrend is about to resume.
Little to No Resistance Ahead of Ethereum
In the event of a bullish impulse, IntoTheBlock’s “In/Out of the Money Around Price” (IOMAP) model reveals there is no supply barrier that will prevent Ethereum from surging towards $500. Based on this on-chain metric, there is only one major area of interest that sits between $462 and $475 due to the number of investors that had previously purchased Ether. Here, roughly 715,000 addresses are holding nearly 370,000 ETH.
This area may have the ability to absorb some of the buying pressure. If prices advance to this level, holders who have been underwater may try to break even on their positions, preventing prices from climbing further. Slicing through this hurdle, however, might see the smart contracts giant aim for $500.
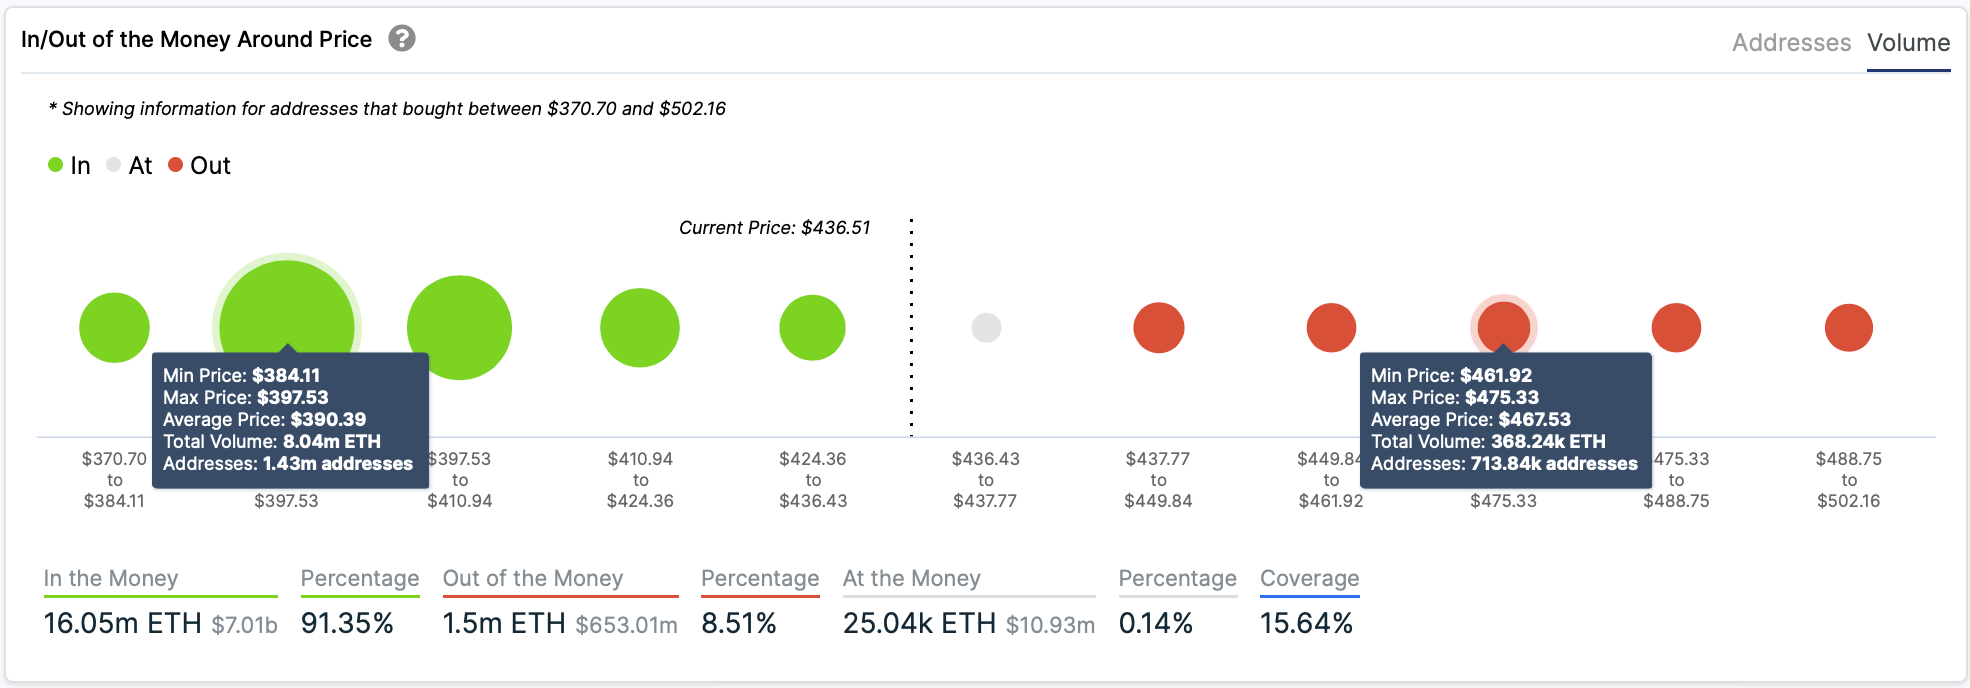
No Major Supply Barrier Ahead of Ether. (Source: IntoTheBlock)
On the flip side, the IOMAP cohorts show that Ether sits on top of stable support. Over 1.4 million addresses bought roughly 8 million ETH between $384 and $390. This crucial area of interest suggests that bears will struggle to push prices down, so right now, the odds favor the bulls.
Macro-Outlook Looks Extremely Bullish
It is worth noting that from a macro-perspective, Ethereum seems to have formed a double bottom pattern. On a large time frame, such as its 3-day chart, Ether’s trend appears to have changed from bearish to bullish the moment prices cut through the $340 resistance level. Now, the W pattern forecasts that regardless of the volatility, ETH will continue to rise towards $800 or higher.
ETH Forms Double Bottom Pattern. (Source: TradingView)
Given the high probability of a bullish breakout, it is imperative to wait for a clear break of the $445 resistance barrier before entering any trade.
Those market participants who have grown impatient and decided to enter the market given the current no-trade zone have been wiped out. Data shows that since the beginning of the month, more than $5.5 billion worth of ETH long and short positions have been liquidated across the board.
For this reason, waiting for Ethereum to get out of the current no-trade zone can prove to be a profitable strategy.
Featured Image by Unsplash
Price tags: ethusd, ethusdt, ethbtc
Chart from TradingView.com