
It’s been a fairly uneventful weekend for Ethereum (ETH). Bitcoin’s inability to break above $4,000 appears to place a damper of momentum within the wider market. A break seems imminent — but in which direction?
One-Hour Chart
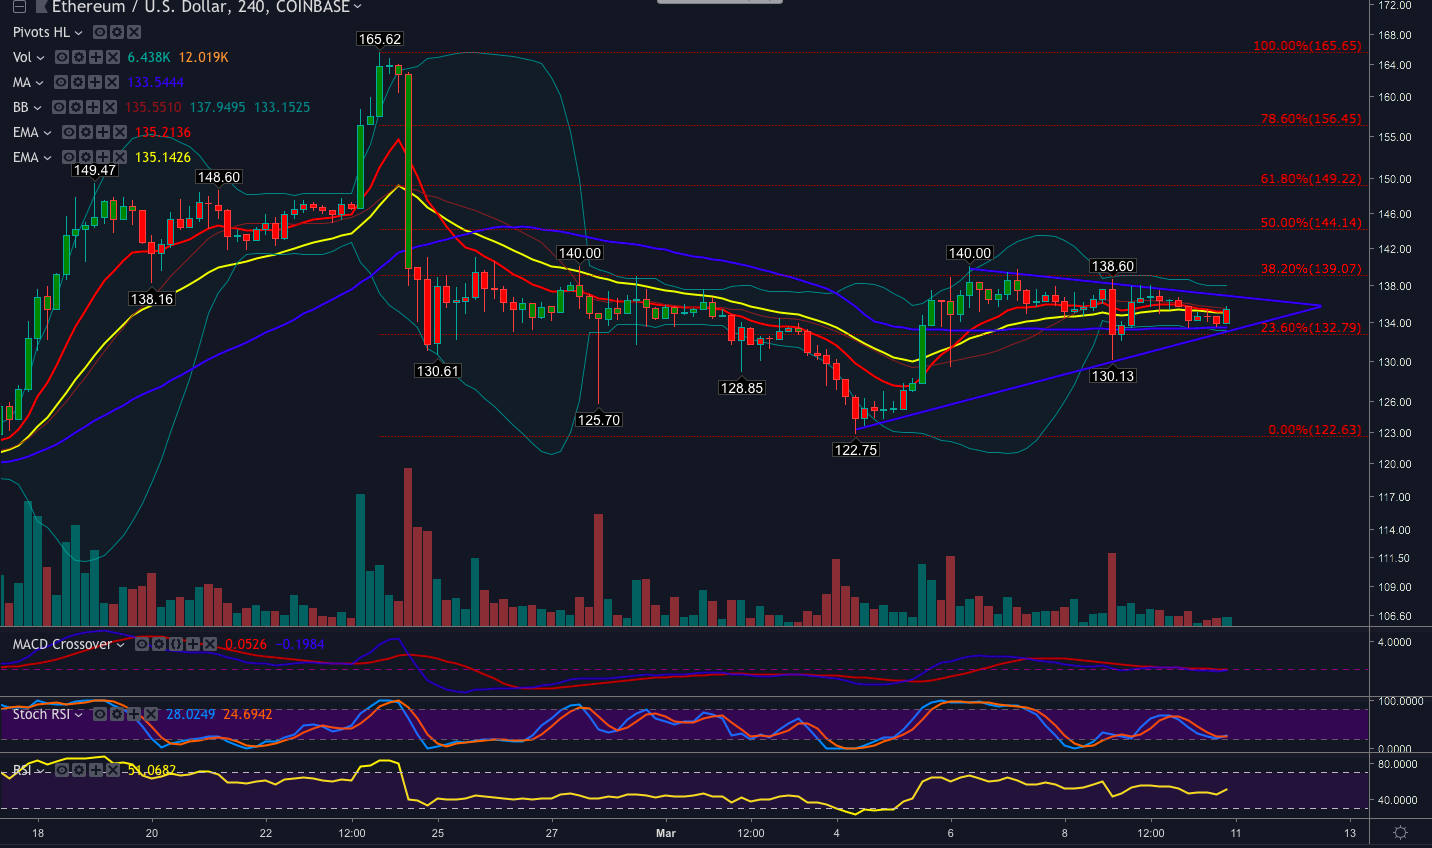
Ethereum is steadily consolidating into a tighter range, notching lower highs and seemingly on the verge of dropping below the 12 and 26 EMA on the 4hr chart. The 4hr and daily chart show Ethereum remains above the ascending trendline with demonstrated support at the 50-MA ($133.40), $132 and $130.
The 12 EMA has crossed below the 26 EMA in the face of declining volume and a retest of the 50-MA and 23.6 percent Fib retracement level seems more likely than not. Dips to swing lows at and below $130 have attracted buyers.
ETH-USD Longs
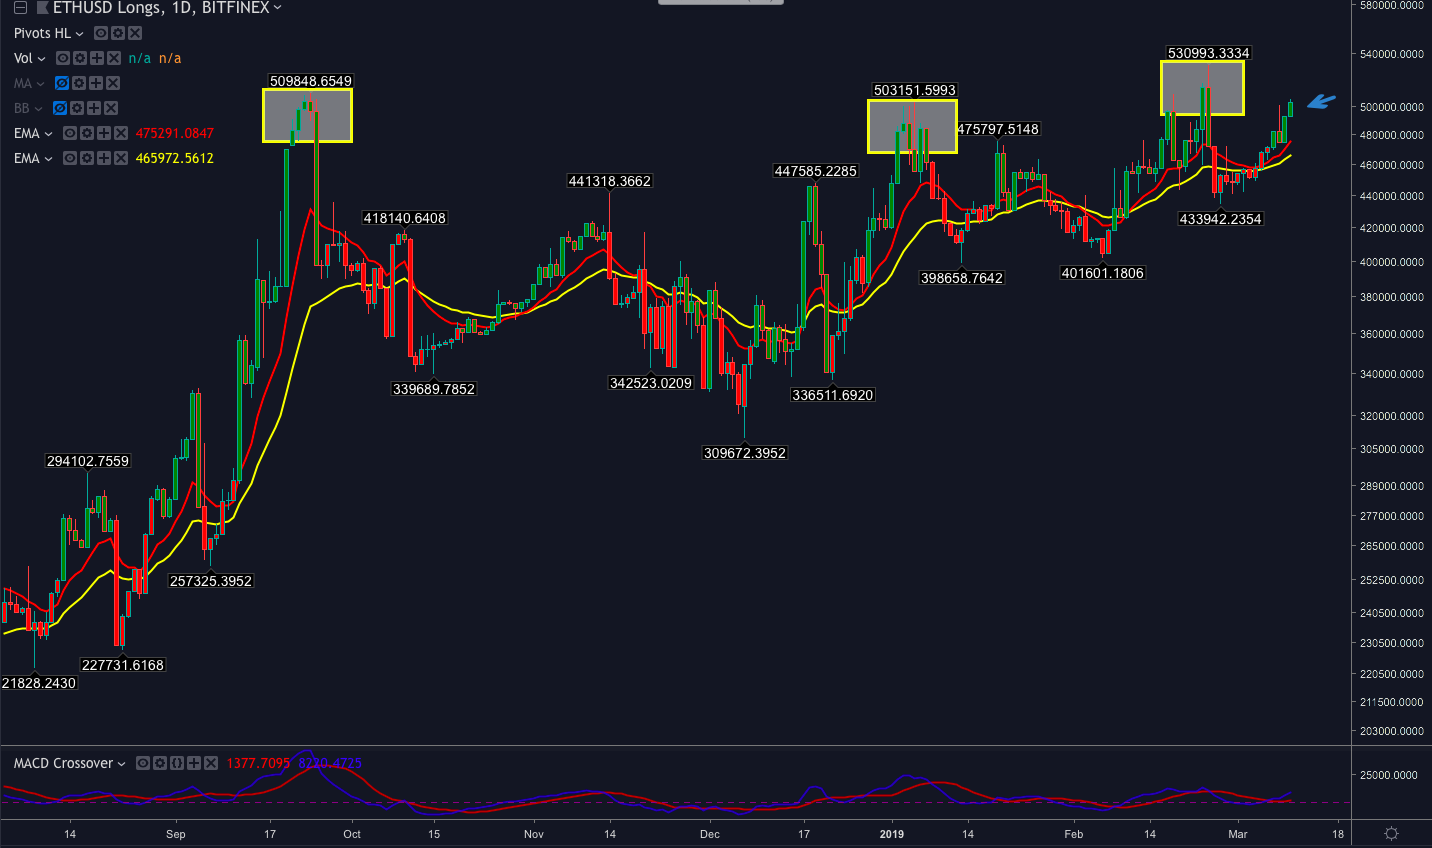
Ethereum price longs are reapproaching all-time highs and near the level and there is a history of longs unwinding above 510,000. If the ETH price is able to overcome the $138 and $140 resistance and longs increase, then the possibility of traders taking profits from the recent swing lows increases.
Therefore, traders might exercise caution when buying into strength and entries near the swing lows could be a more sensible strategy.
Where do you think ETH price will go over the short-term? Let us know what you think in the comments below!
Trade Bitcoin (BTC), Litecoin (LTC) and other cryptocurrencies on online Bitcoin forex broker platform evolve.markets.
[Disclaimer: The views expressed in this article are not intended as investment advice. Market data is provided by Bitfinex and Coinbase. The charts for analysis are provided by TradingView.]
Images courtesy of Shutterstock, TradingView. Market data sourced from Bitfinex and Coinbase.
The post Ethereum Price Analysis: Is it ‘Break’ Time? appeared first on Bitcoinist.com.