
Bitcoin price tested the $30,000 support and it is now recovering higher against the US Dollar. BTC is likely to face a strong selling interest near $37,000 and $38,000.
- Bitcoin extended its decline and it even traded close to the $30,000 support.
- The price is now well below the $38,000 resistance and the 100 hourly simple moving average.
- There is a key bearish trend line forming with resistance near $37,000 on the hourly chart of the BTC/USD pair (data feed from Kraken).
- The pair is likely to face a strong selling interest near the $37,000 zone and the 100 hourly SMA.
Bitcoin Price is Facing Hurdles
Bitcoin failed to stay above the $35,000 support and it extended its decline. BTC even broke the $32,000 support zone and it settled well below the 100 hourly simple moving average.
It almost tested the $30,000 support zone and a low was formed near $31,037. Recently, it started an upside correction above the $32,000 and $33,000 levels. There was a break above the 50% Fib retracement level of the recent decline from the $38,827 swing high to $31,037 swing low.
Bitcoin is now facing resistance near the $35,800 level. It represents the 61.8% Fib retracement level of the recent decline from the $38,827 swing high to $31,037 swing low.
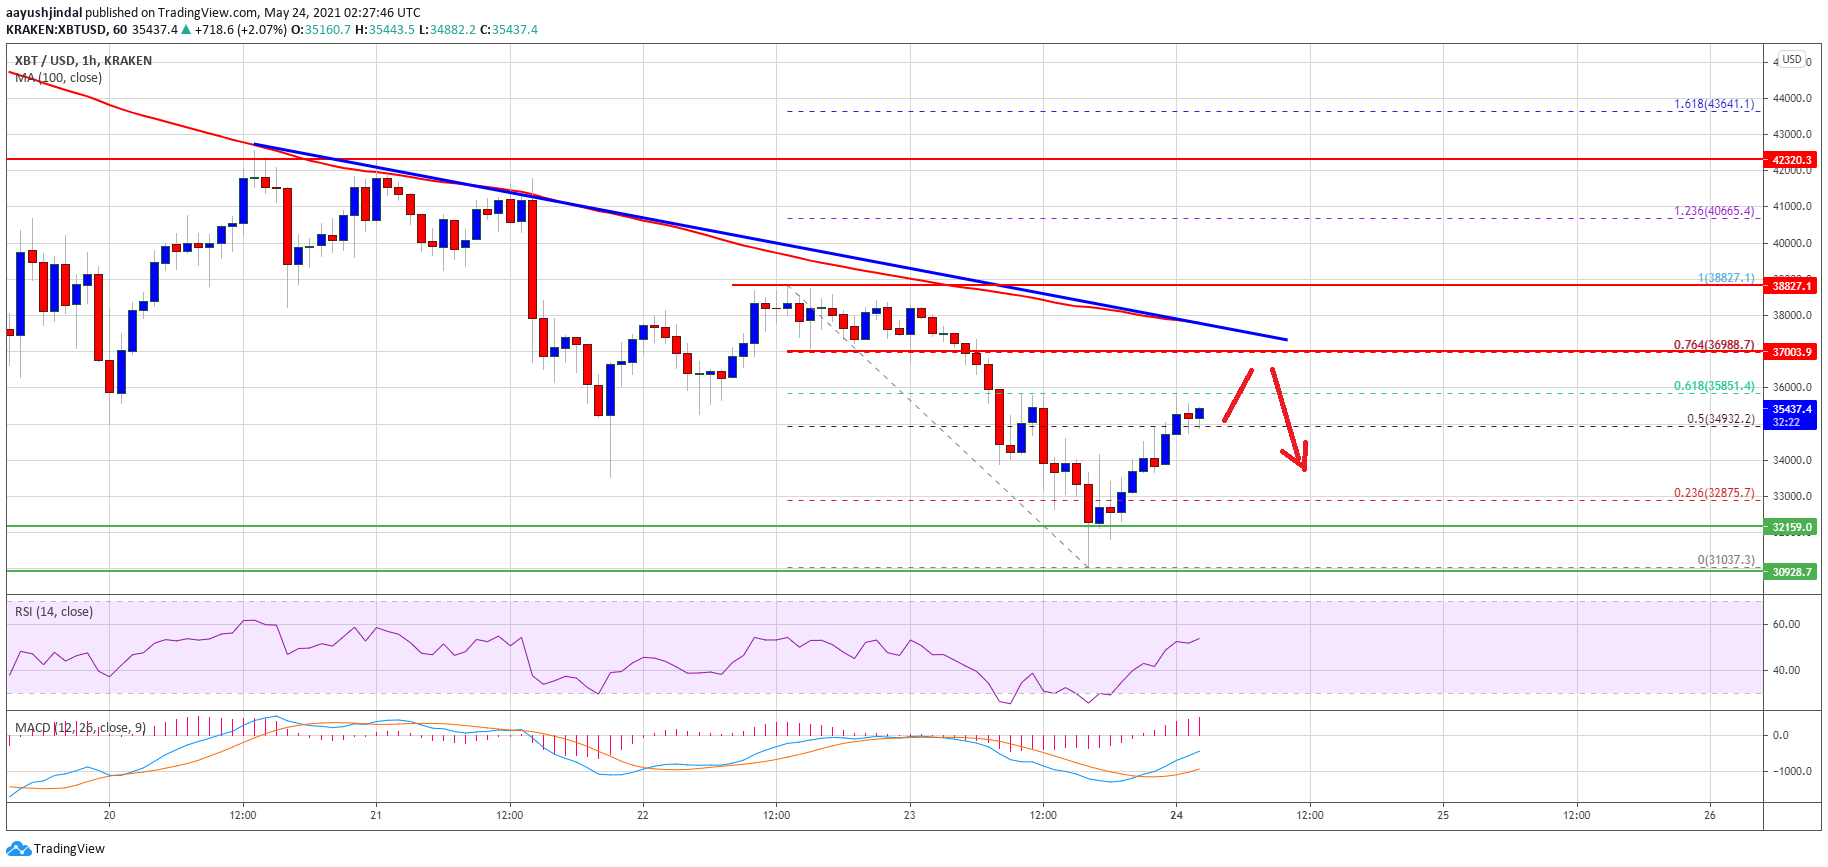
Source: BTCUSD on TradingView.com
The main resistance is now forming near the $37,000 level. There is also a key bearish trend line forming with resistance near $37,000 on the hourly chart of the BTC/USD pair. The 100 hourly simple moving average is also near the $37,000 resistance zone.
A clear break above the trend line resistance and the 100 hourly simple moving average could open the doors for a larger recovery towards the $40,000 level. An intermediate resistance is near the $38,000 level.
Fresh Drop in BTC?
If bitcoin fails to clear the $37,000 resistance, there is a risk of a fresh decline. An initial support on the downside is near the $34,000 level.
The first major support is now forming near the $32,000 zone. A downside break below the $32,000 support could start a fresh decline towards the $30,000 support zone in the near term.
Technical indicators:
Hourly MACD – The MACD is slowly gaining pace in the bullish zone.
Hourly RSI (Relative Strength Index) – The RSI for BTC/USD is now above the 50 level.
Major Support Levels – $34,000, followed by $32,000.
Major Resistance Levels – $35,800, $37,000 and $38,000.