
Fascinating research from JPMorgan reveals that although the stock market is booming, the performance of your individual portfolio depends heavily on what state you live in. That’s because U.S. investors living in different regions tend to favor some S&P 500 sectors over others.
Your Stock Portfolio Likely Has a Hidden Regional Bias
According to JPMorgan’s Q3 2019 Guide to Markets, New Englanders are 9% more likely than the national average to own stocks in financials. They’re 10% less likely, however, to own energy stocks.
Everyone south of the Mason-Dixon line from Florida to Texas is 14% more likely to include energy stocks in their portfolio. But southerners are 7% less likely than the national average to own shares in technology companies.
The Midwest is 12% below the national average for investing in financials, even with Warren Buffett living there. But a Cornhusker fan chosen at random is 11% more likely than the average American to have industrials in their stock portfolio. Residents of the Western states, meanwhile, are 9% less likely to own shares in industrials companies. But they’re 10% more likely to own technology stocks.
When a retirement planner at Shorebridge Wealth Management pointed out this week that JPMorgan’s findings suggest “behavioral investment bias,” someone replied, “I see it as evidence of ‘buy what you know.'”
JPMorgan’s regional breakdown of asset allocation by sector does strongly indicate that a lot of Americans’ stock portfolios reflect that classic investment advice of legendary fund manager Peter Lynch.
Which U.S. Region Comes Out on Top?
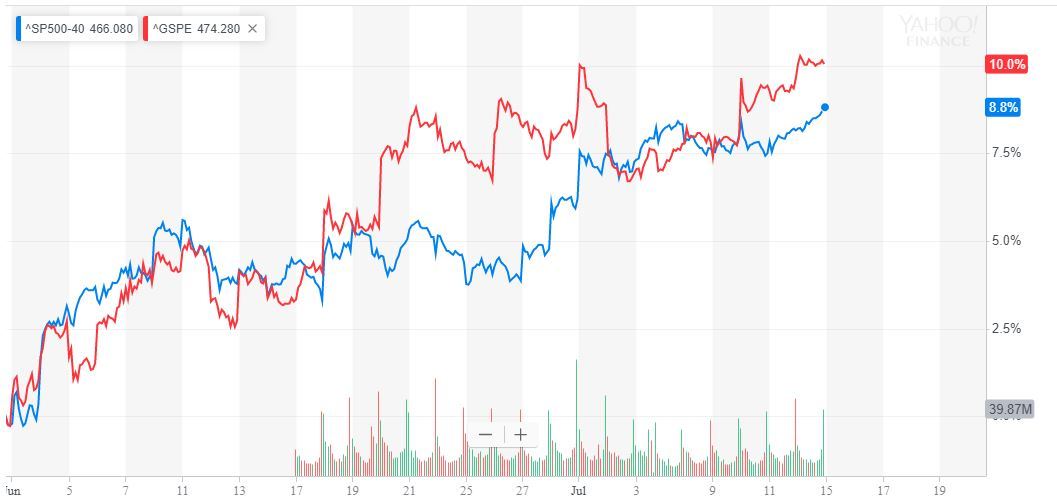
If you’re living in New England, you might be having a good month since financials are up a little over 4%. But New Englanders could have done even better if they had more exposure to the energy industry in their portfolios. Energy stocks are surging with U.S. oil prices at a six week high.
That’s good news for investors in the American South. Their exposure to the energy industry deviated from the average more wildly than any other industry sector for any other region. However, with fewer financial stocks under their belt, southerners might be missing out on the banking boom this past month.
Stock portfolios in the industrial Midwest are on fire this month too. They’ve seen an average increase of over 4.5% over the last thirty days in S&P Industrials. This sector’s companies are on the move. An estimated 89% or more of the shares in this sector are trading above the 5-day, 20-day, and 50-day moving averages. A full 70% are above the 100-day moving average, and three-quarters are trading above the 200-day average.
The tech stock-heavy Western states may be missing out on industrials this month, but don’t feel too sorry for them. The Nasdaq is up 0.59% for the month and just reached a new record high after Federal Reserve Chairman Jerome Powell hinted at the much-anticipated Fed interest rate cut.