
Bitcoin’s recent consolidation has thrown most investors for a loop: the majority aren’t too sure what comes next for the cryptocurrency market.
Some, though, have made progress in discussing the recent price action. One analyst observed that stepping back and looking at BTC’s medium-term price action, the past three months look extremely structurally similar to a pattern from May 2019.
Should Bitcoin continue to track the trajectory it took last time this particular market structure was seen, a strong surge will transpire in the coming weeks.
Related Reading: Crypto Tidbits: BTC Holds $9k, Ethereum DeFi Gains Traction, Trump Talked BTC in 2018
Bitcoin Looks Almost Exactly Like It Did in May 2019, Prior to a 50% Surge
A trader recently shared the chart below, noting that Bitcoin’s price action since the March 12-13 crash to $3,700 looks extremely similar to that seen from April to early-June of 2019.
Both periods have a steady uptrend, a vertical rally, then a choppy consolidation. Last year, the choppy consolidation resolved higher, with BTC rallying 50% in two weeks from the ~$9,000 baseline of the rally to the $14,000 year high.
Bitcoin trading as it did back then will see it hit $15,000 by the end of the month.
Bitcoin price analysis by trader "Caesar" (@Thrillmex on Twitter). Chart from TradingView.com
The expectations that BTC will break higher from the current consolidation have been echoed by a data analyst.
He explained that in the past two years, the recent consolidation “is the 10th occurrence of $btcusd being stuck in a sub 20% range for longer than 5 weeks.” Seven out of the nine historical consolidations have “led to a pump.”
Although it’s not a 100% strike rate, this historical precedent suggests that there’s a higher likelihood of Bitcoin’s current range resolving higher than resolving lower.
Investors Are Betting on Upside
Investors are betting on the bull case.
According to data shared by CryptoQuant (CQ.live), Bitcoin miners are barely selling any of the cryptocurrency that they hold.
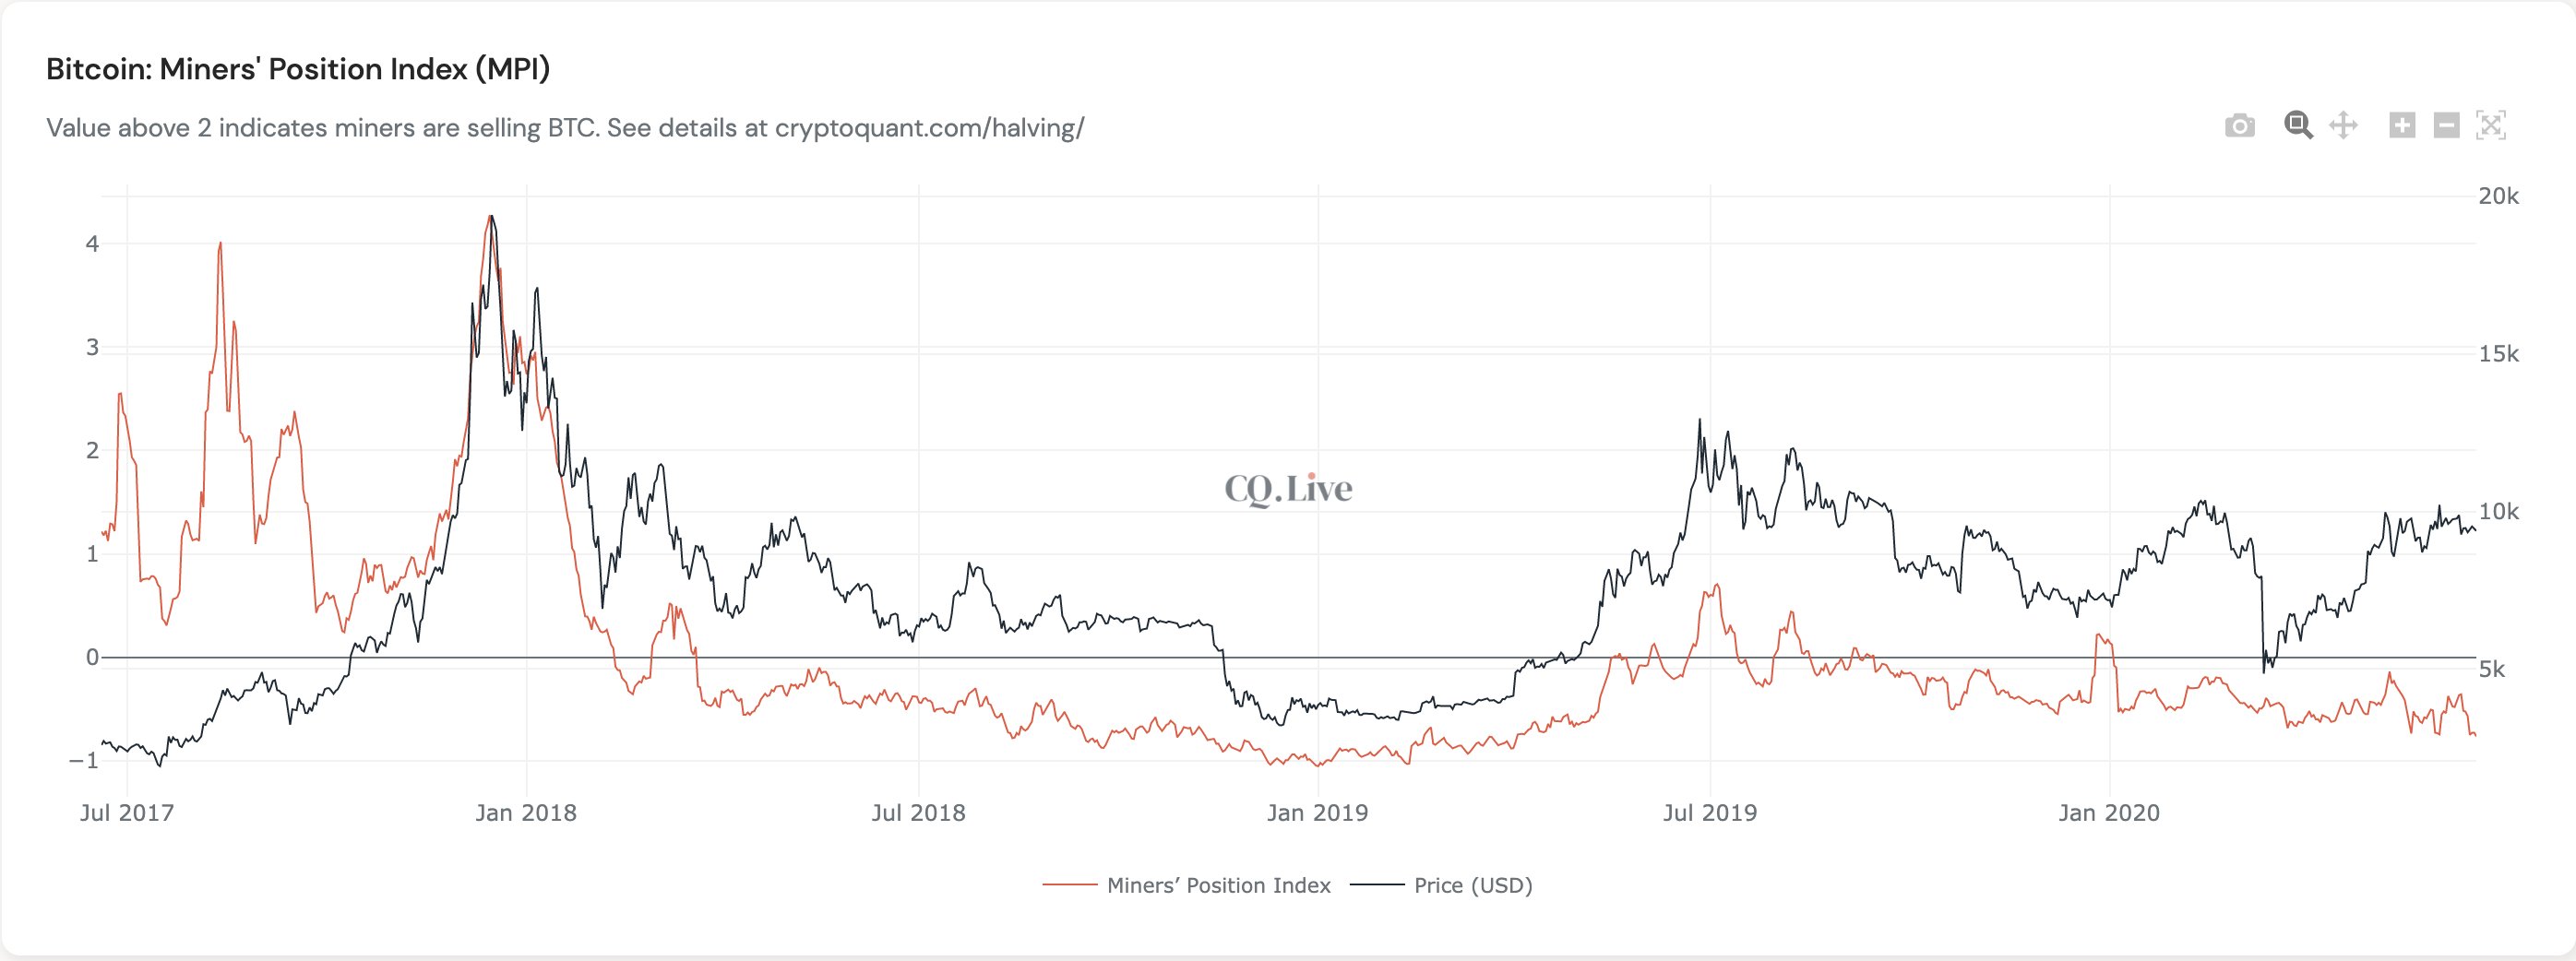
Bitcoin Miners' Position Index chart shared by firm CryptoQuant (CQ.live)
As can be seen in the chart above, the BTC Miners’ Position Index (MPI) moves above zero when prices near a local peak. The metric is currently nearing lows not seen since the market bottom in late-2018/early-2019, suggesting miners see similar potential in BTC to move higher.
Adding to this, Alistair Milne of Altana Digital Currency Fund recently observed that there is a growing amount of Bitcoin that hasn’t moved over the past year:
“What if I told you that the amount of #Bitcoin held without moving for >12 months is on course to make new ATHs (>61%) and barely changed in the March COVID panic … These levels of HODL’ing were last seen when the price was $200-500 back in 2015/16.”
This propensity to HODL amongst BTC investors has the potential to boost prices due to supply-demand dynamics.
Related Reading: Last 2 Times This Signal Was Seen, BTC Dove 50%. It’s About to Happen Again
Featured Image from Shutterstock
Price tags: xbtusd, btcusd, btcusdt
Charts from TradingView.com
Last Time BTC Looked Like This, It Rallied 80% In Two Weeks