
Bullish divergence has become visible on the 4 hour chart as Litecoin consolidates within a tight range. This is the result of the previous breakout mentioned in a recent analysis.
Litecoin 4 Hour Chart Analysis
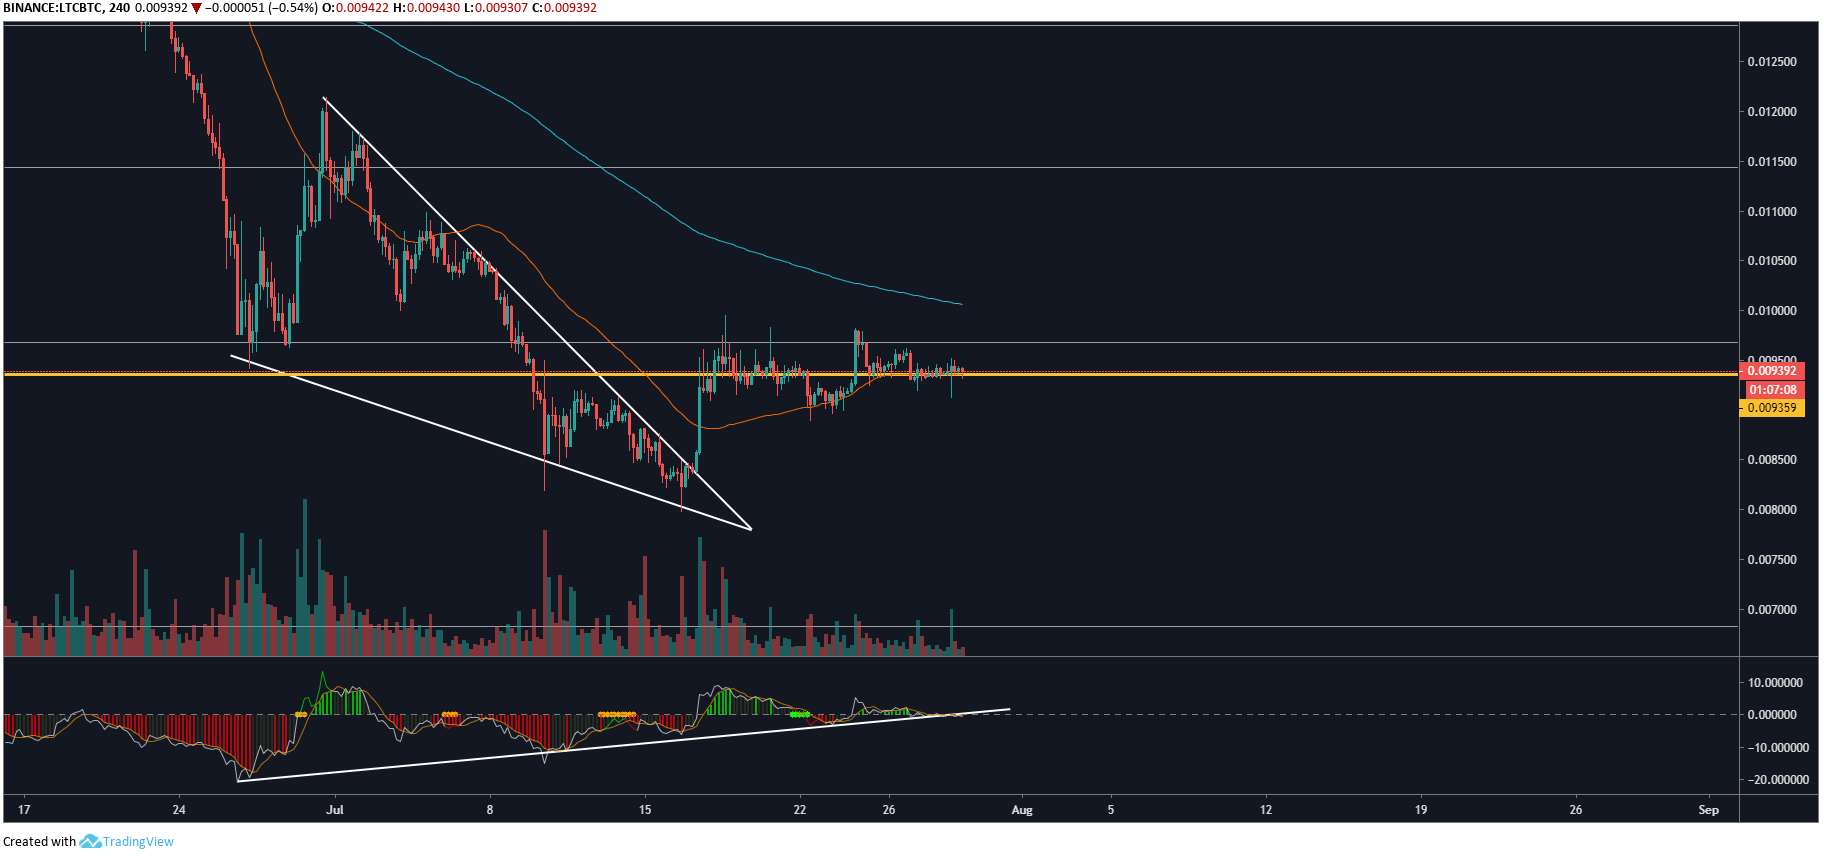
On the 4 hour LTC/BTC chart, we can see a bullish divergence evident by the three higher highs on Maxx Momentum. This is creating a clear uptrend in conjunction with the three lower lows within the descending wedge. Since then, price levels have broken to the upside and are now consolidating within a tight range whilst touching POC.
Consolidation within such a tight range after a bullish breakout and clear bullish divergence is a sure sign of a big move to come. Volume has been descending since late June, and a large volume spike could very well break that descending pattern and propel price levels up out of the tight consolidation range between 0.0090 and 0.0097 sats.
Price action is also touching the 50 MA with the 200 EMA, and moving closer to the market price by the day. This is another promising sign of consolidation. With the Litecoin halving scheduled for August 6th, it’s to no surprise that we’re seeing signs of a big move to come in the next few days.
Litecoin Daily Chart Analysis
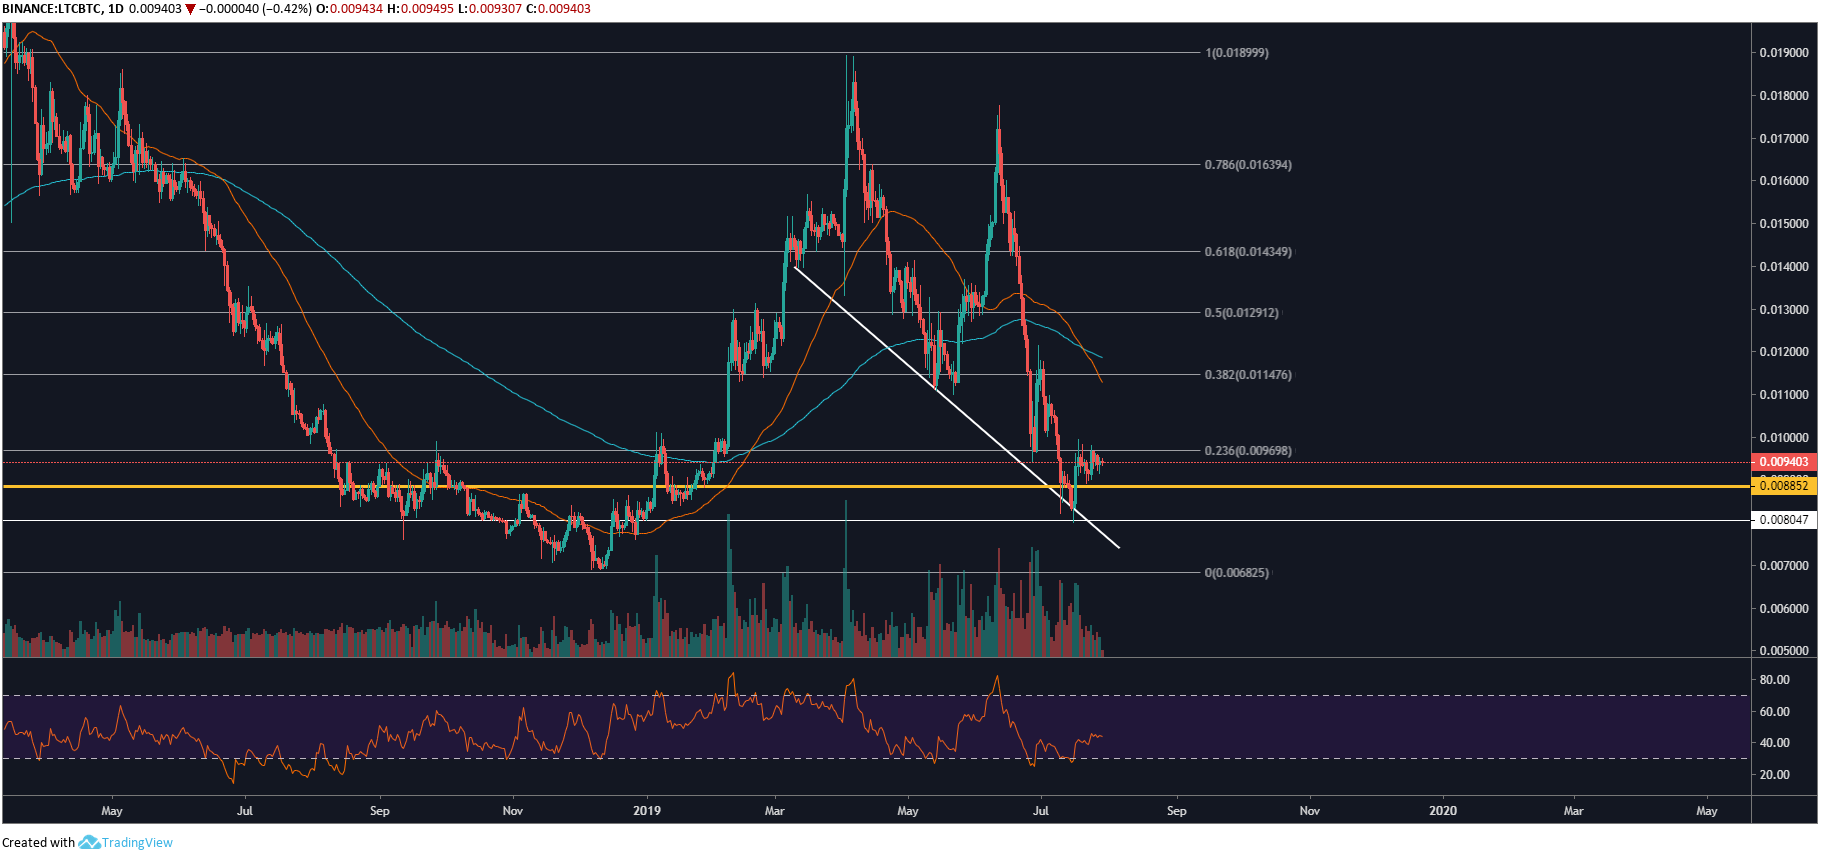
On the Daily chart for LTC/BTC, we can see the sharp decline in price levels throughout 2019 that brought the current price down to around 0.0090 sats. Despite the sharp descent, the volume has remained high which is a sure indication that people are still buying and trading LTC despite the bearish trend. This means a reversal is somewhat imminent and will largely depend on how BTC and other high volume altcoins play out.
The current market price is the furthest away from the 50 MA and 200 EMA that LTC/BTC has seen throughout its whole lifetime on Binance exchange. This leads me to believe LTC is coming to the end of its bearish cycle and a reversal will begin to play out around the current market price. It would take an awfully large amount of selling pressure to drive price levels even further away from the moving averages mentioned, and looking at the level of buying pressure throughout this bearish phase, this outcome looks increasingly unlikely.
Do you think LTC will spur a short-term reversal as we near the halving on August 6th? Please leave your thoughts in the comments below!
Images via Shutterstock, Litecoin charts by Tradingview
The post Litecoin Price Analysis: Bullish Divergence Spotted on LTC/BTC appeared first on Bitcoinist.com.