
Advertisement
Long-Term Outlook
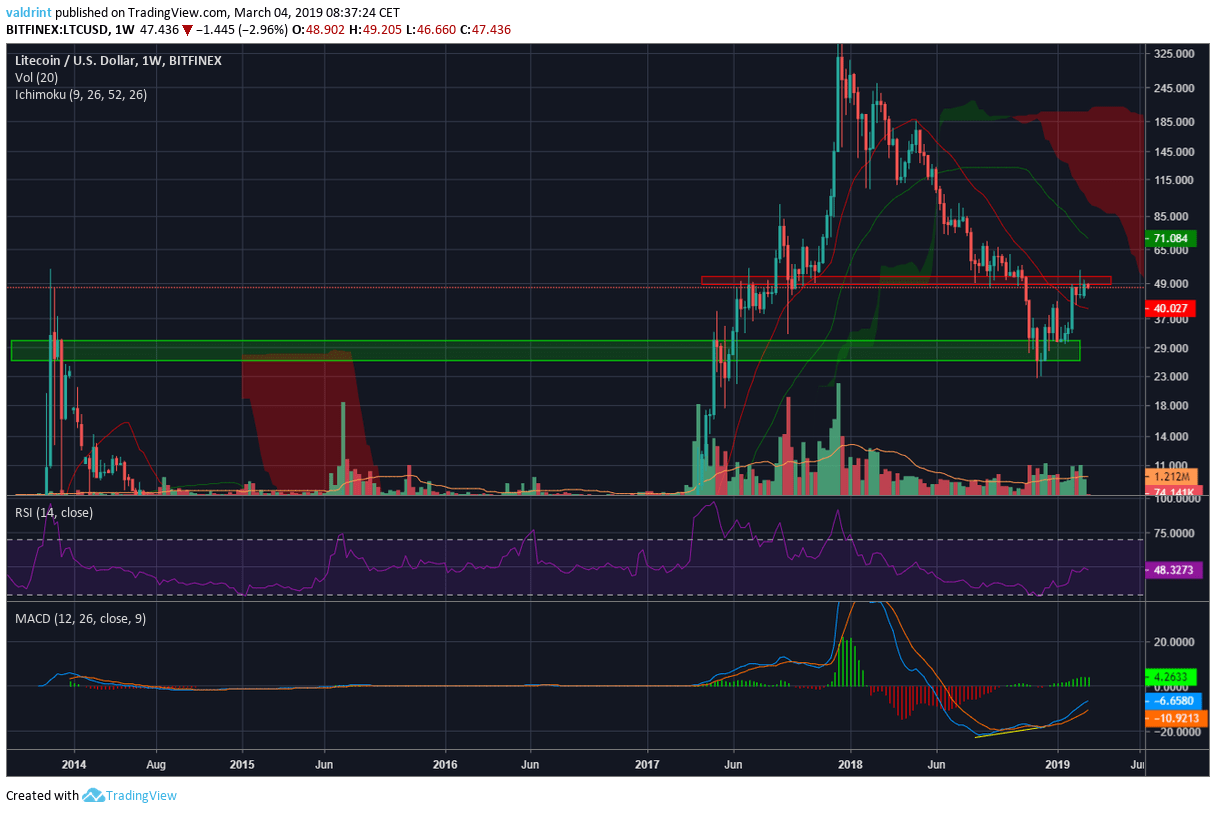
Litecoin Weekly Chart – Source: Tradingview.com
A look at the Weekly chart for LTC/USD shows that price made a temporary bottom at $28, inside the support area formed by the highs of 2014.
It is currently trading at $48, slightly above the 21-period moving average but below the 50-period MA and the Ichimoku cloud.
Advertisement
There is also a minor resistance area near $50.
The RSI is at 48, indicating neither oversold nor overbought conditions.
On a more positive note, there has been a significant bullish divergence in the MACD, which is moving upward with strength but has not turned positive yet.
Given this information, I am bullish on the long-term.
Medium-Term Outlook
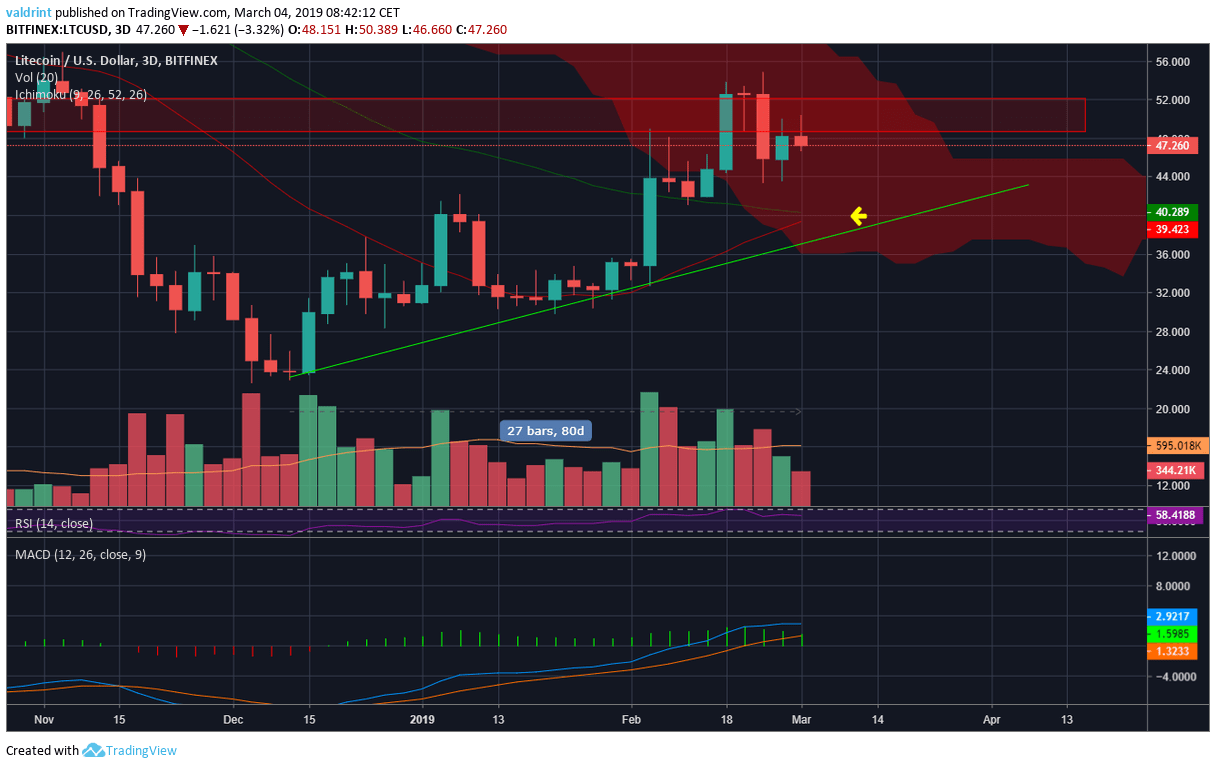 Litecoin 3-Day Chart – Source: Tradingview.com
A look at the 3-day chart for LTC/USD shows that price is trading inside the negative Ichimoku cloud.
Also, we can see that price is following an ascending support line and has been doing so for the past 80 days.
Furthermore, we can see that the 21 and 50-period MAs are very close to making a bullish cross and are offering support to price.
While the MACD is positive, it has started to lose strength.
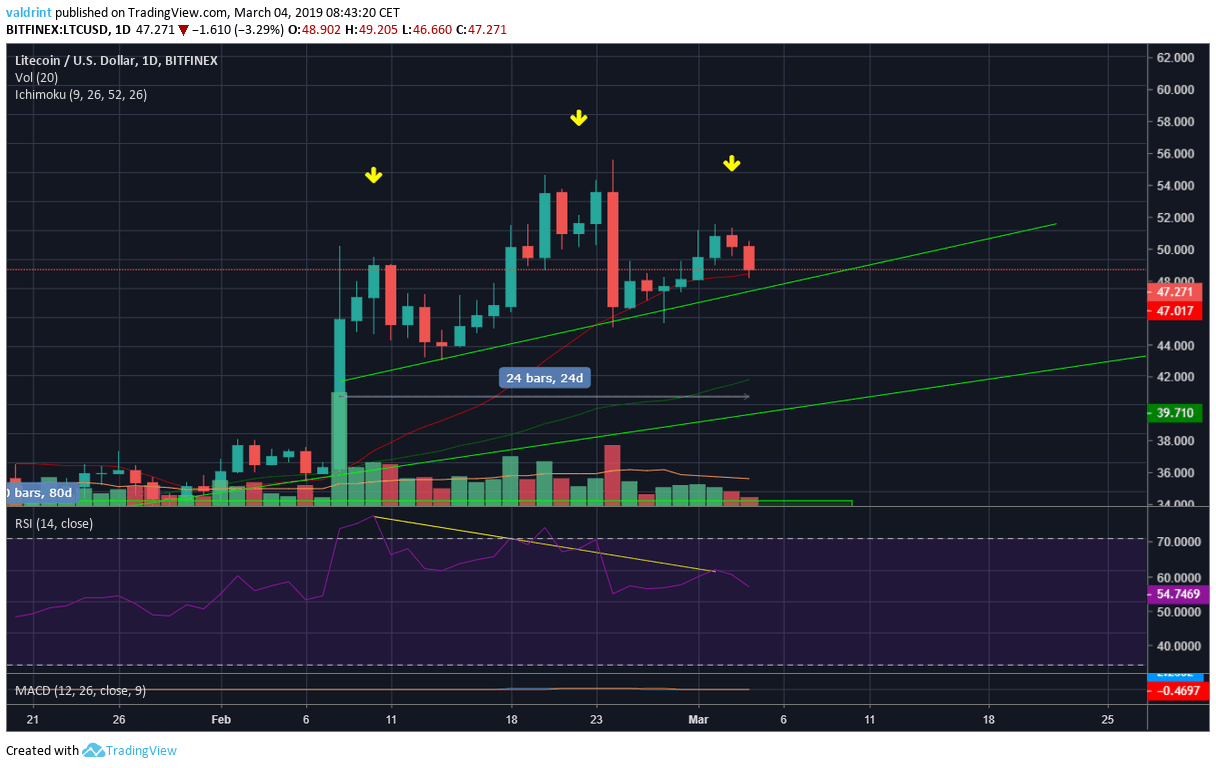 Litecoin Daily Chart – Source: Tradingview.com
A look at the Daily chart shows that price is possibly making a head and shoulders pattern (bearish reversal).
Furthermore, the price is following a medium-term support line (neckline of H&S) and has been doing so for 24 days.
Price has also found support above the 21-period moving average.
The head and shoulders pattern has been combined with a bearish divergence in the RSI, which is currently at 54.
Short-Term Outlook and Price Prediction
 Litecoin 6-Hour Chart – Source: Tradingview.com
A look at the 6-hour chart shows that besides the support line, the price is possibly following a descending resistance line that has only been validated twice.
Both lines combine to create a symmetrical triangle, which is projected to end on March 8th.
If the support line fails to hold the price, the next support area will be found near $42.
Furthermore, we can see that the 21 and 50-period MAs have made a bearish cross and are offering resistance to price.
Price Prediction:
I believe that during this week the price will break down from the support line and fall to the support area near $42.
Conclusions:
- Price is trading inside a long-term head and shoulders pattern.
- There is a medium-term bullish divergence.
- Price is trading inside a short-term symmetrical triangle.
Latest Litecoin News:
| DISCLAIMER: Investing or trading in digital assets, such as those featured here, is extremely speculative and carries substantial risk. This analysis should not be considered investment advice, use it for informational purposes only. Historical performance of the assets discussed is not indicative of future performance. Statements, analysis, and information on blokt and associated or linked sites do not necessarily match the opinion of blokt. This analysis should not be interpreted as advice to buy, sell or hold and should not be taken as an endorsement or recommendation of a particular asset. |
RELATED ARTICLES
MORE FROM OUR PARTNERS
Advertisement
blokt.com is author of this content, TheBitcoinNews.com is is not responsible for the content of external sites.
source: https://blokt.com/technical-analysis/litecoin-price-prediction-ltc-is-creating-a-head-and-shoulders-pattern-will-the-neckline-provide-support
TheBitcoinNews.com is here for you 24/7 to keep you informed on everything crypto. Like what we do? Tip us some Satoshi with the exciting new Lightning Network Tippin.me tool!