
Ripple gained bullish momentum above $0.5000 and $0.5500 against the US Dollar. XRP price remains attractive on dips and it is likely to climb further above $0.5750.
- Ripple gained strength and it even spiked above $0.5500 against the US dollar.
- The price is now trading nicely above $0.5000 and the 100 simple moving average (4-hours).
- There is a key bullish trend line forming with support near $0.5120 on the 4-hours chart of the XRP/USD pair (data source from Kraken).
- The pair could dips in the short-term, but the bulls are likely to remain active above $0.5000.
Ripple’s XRP Price Turns Green
This week, ripple’s XRP remained stable above $0.5000, while bitcoin and ethereum extended their increase. Earlier, XRP formed a support base above $0.4550 before surging above the $0.5000 resistance.
It broke many hurdles near $0.5200 and $0.5500. It traded as high as $0.5764 before starting a consolidation phase. There was a minor drop towards the $0.5500 support. The price also tested the 23.6% Fib retracement level of the upward move from the $0.4536 low to $0.5764 high.
It is still trading nicely above $0.5000 and the 100 simple moving average (4-hours). There is also a key bullish trend line forming with support near $0.5120 on the 4-hours chart of the XRP/USD pair.
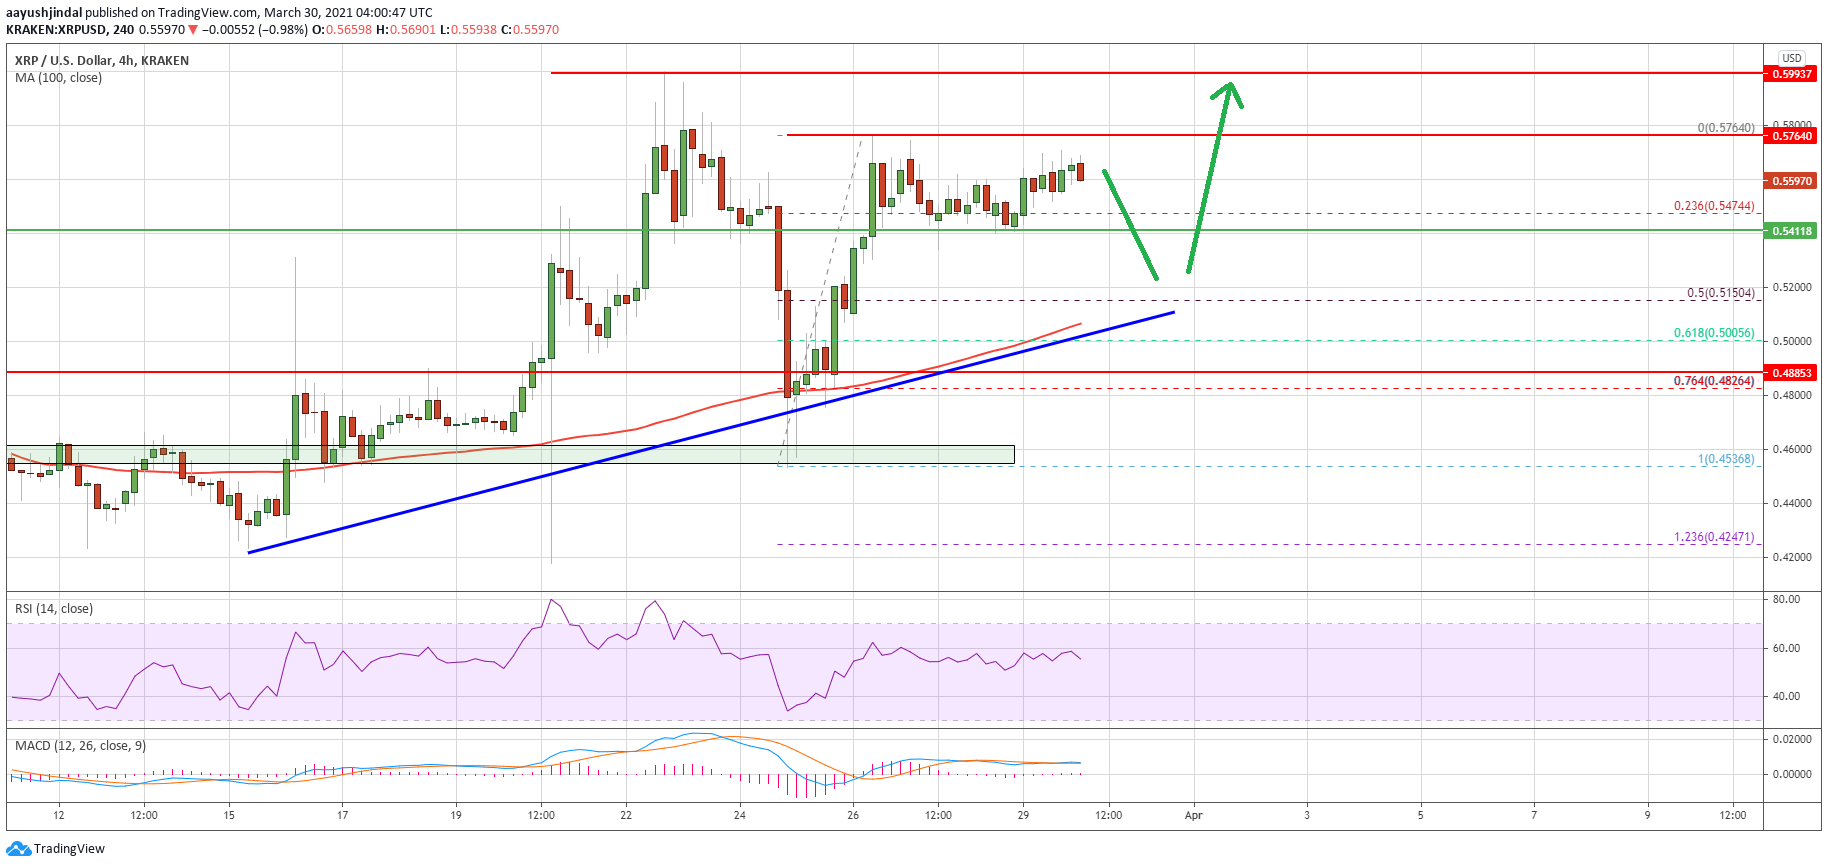
Source: XRPUSD on TradingView.com
The trend line is close to the 50% Fib retracement level of the upward move from the $0.4536 low to $0.5764 high. On the upside, the $0.5750 level is an immediate resistance. The next major resistance is near the $0.6000 level. A successful close above the $0.6000 level is likely to set the pace for more gains in the coming sessions. In the stated case, the bulls might aim a test of $0.6380.
Fresh Drop in XRP?
If ripple fails to clear the $0.5750 resistance or $0.6000, it could start a fresh decline. An initial support on the downside is near the $0.5450 level.
The first major support is near the $0.5150 level. The main support is near the trend line, $0.5100, and the 100 simple moving average (4-hours). Any more losses might lead the price towards the $0.4500 support zone in the near term.
Technical Indicators
4-Hours MACD – The MACD for XRP/USD is now gaining pace in the bullish zone.
4-Hours RSI (Relative Strength Index) – The RSI for XRP/USD is now above the 50 level.
Major Support Levels – $0.5450, $0.5120 and $0.5000.
Major Resistance Levels – $0.5750, $0.6000 and $0.6380.