
Ripple is trading nicely above the $0.1950 support zone against the US Dollar. XRP price is likely to start a strong rally (similar to bitcoin) if it clears the $0.2000 resistance.
- Ripple price is trading well above the $0.1900 and $0.1920 support levels against the US dollar.
- The price is currently stuck near the $0.2000 resistance zone.
- There is a significant bullish flag forming with resistance near $0.1995 on the 4-hours chart of the XRP/USD pair (data source from Kraken).
- The pair is likely to start a strong rally if it settles above the $0.2000 and $0.2030 resistance levels.
Ripple Price Could Follow Bitcoin
In the past few sessions, ripple’s XRP remained stable above the $0.1920 support level. It even settled above the $0.1950 pivot level and the 100 simple moving average (4-hours).
Recently, there was a spike above the $0.2000 resistance, but the price failed to gain traction. A high is formed near $0.2015 and the price is currently consolidating in a tiny range. An initial support is near the $0.1965 level and the 100 simple moving average (4-hours).
The 50% Fib retracement level of the recent wave from the $0.1916 low to $0.2015 high is also near $0.1965. The next major support is near the $0.1950 level, followed by a connecting bullish trend line at $0.1940 on the 4-hours chart of the XRP/USD pair.
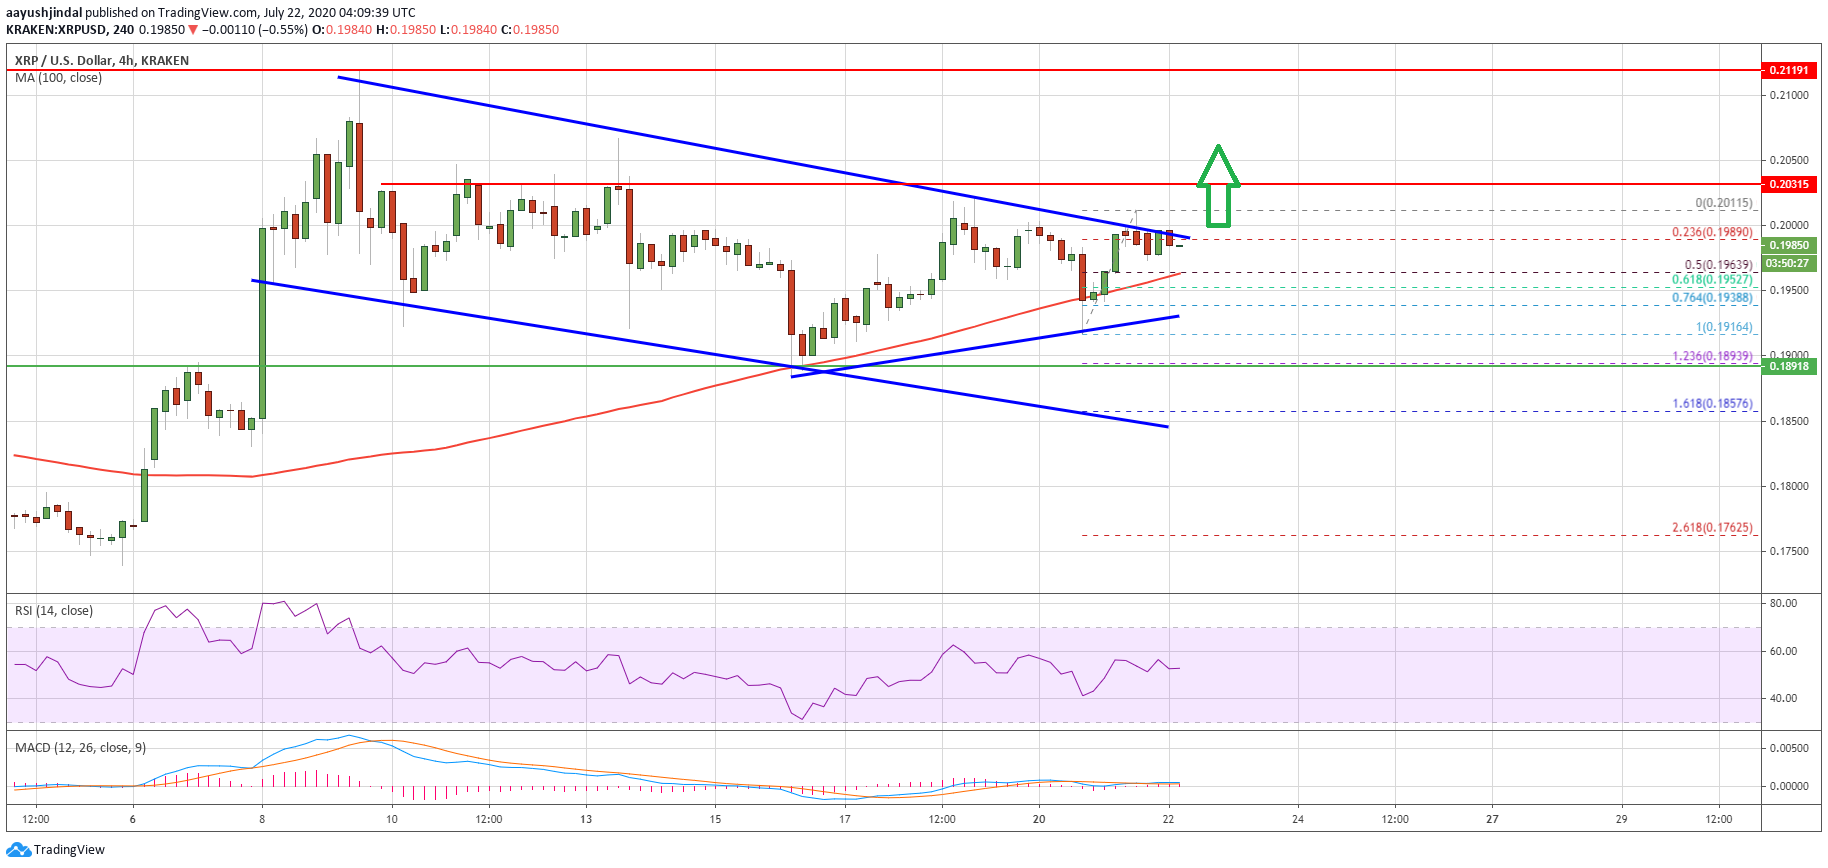
Ripple (XRP) price trades near $0.2000. Source: TradingView.com
The trend line is close to the 76.4% Fib retracement level of the recent wave from the $0.1916 low to $0.2015 high. More importantly, there is a significant bullish flag forming with resistance near $0.1995 on the same chart.
If there is an upside break and close above the $0.2000 level, the price could continue to rise. The next major resistance is near the $0.2030 level, above which the bulls are likely to aim a test of the $0.2120 resistance.
Dips Likely Supported in XRP
It seems like ripple could follow bitcoin’s recent upside break above the $9,300 resistance. If it fails to clear the $0.2000 resistance, there might be a short-term downside correction.
On the downside, the first major support is near the $0.1950 level, below which the price could revisit the main $0.1900 support level in the near term.
Technical Indicators
4-Hours MACD – The MACD for XRP/USD is struggling to gain strength in the bullish zone.
4-Hours RSI (Relative Strength Index) – The RSI for XRP/USD is currently well above the 50 level.
Major Support Levels – $0.1965, $0.1950 and $0.1920.
Major Resistance Levels – $0.2000, $0.2030 and $0.2120.
Take advantage of the trading opportunities with Plus500
Risk disclaimer: 76.4% of retail CFD accounts lose money.