
Ripple started a fresh decline after it failed to clear the $0.6800 resistance against the US Dollar. XRP price is showing bearish signs below the 100 hourly SMA and facing many hurdles.
- Ripple started a sharp downside correction from the $0.6800 resistance against the US dollar.
- The price is now trading below the $0.6250 support and the 100 hourly simple moving average.
- There was a break below a major bullish trend line with support near $0.6460 on the hourly chart of the XRP/USD pair (data source from Kraken).
- The pair is likely to continue lower unless it surpasses $0.6300 and the 100 hourly SMA.
Ripple Price is Facing Hurdles
Recently, we saw a sharp bearish reaction in bitcoin, Ethereum, and ripple against the US Dollar. XRP price broke the $0.6450 support zone to move into a short-term bearish zone.
The decline gained pace after there was a break below a major bullish trend line with support near $0.6460 on the hourly chart of the XRP/USD pair. The pair even settled below $0.6300 level and the 100 hourly simple moving average.
There was a spike below the $0.6000 support, but the price remained stable above $0.5800. The recent swing low was formed near $0.5938 and the price is currently consolidating.
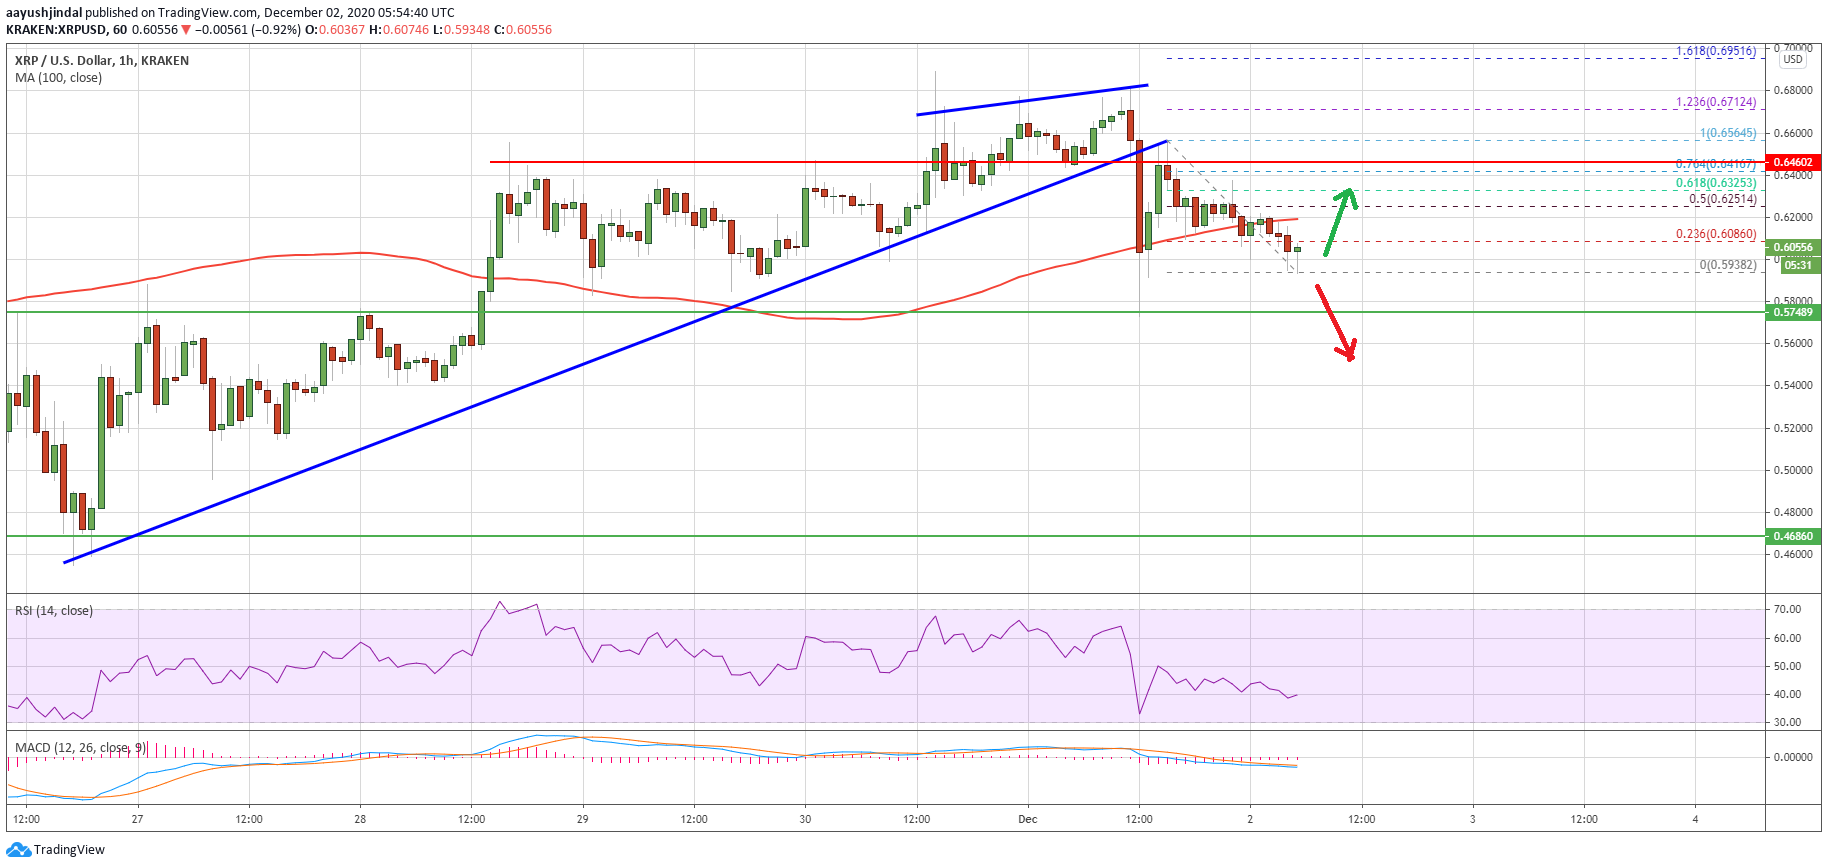
Source: XRPUSD on TradingView.com
An initial resistance is near the $0.6080 level. It is close to the 23.6% Fib retracement level of the downward move from the $0.6564 swing high to $0.5938 low. The first major resistance is near the $0.6200 level and the 100 hourly simple moving average.
The next resistance is near the $0.6250 level or the 50% Fib retracement level of the downward move from the $0.6564 swing high to $0.5938 low. A clear break above the $0.6250 and $0.6300 resistance levels might clear the path for more upsides towards $0.6550 or $0.6640.
Key Supports For XRP
If there is no upside break in ripple above $0.6300, there could be more losses. An initial support on the downside is near the $0.6000 level.
The next key support is forming near the $0.5920 level, below which the price might revisit the main $0.5750 support. Any more losses could lead the price towards the $0.5200 level.
Technical Indicators
Hourly MACD – The MACD for XRP/USD is losing momentum in the bearish zone.
Hourly RSI (Relative Strength Index) – The RSI for XRP/USD is currently well below the 50 level.
Major Support Levels – $0.6000, $0.5920 and $0.5750.
Major Resistance Levels – $0.6250, $0.6300 and $0.6550.