
Ripple is down 5% and it broke the key $0.2380 support zone against the US Dollar. XRP price is currently consolidating losses and upsides are likely to remain capped.
- Ripple started a major decline below the $0.2440 and $0.2380 support levels against the US dollar.
- The price is down 5% and it is now trading well below the 100 hourly simple moving average.
- There is a key contracting triangle forming with resistance near $0.2335 on the hourly chart of the XRP/USD pair (data source from Kraken).
- The pair could face a strong selling interest near the $0.2380 and $0.2400 levels in the near term.
Ripple Price Dives 5%
After a failed attempt to clear the $0.2500 resistance, ripple started a fresh decline. XRP price broke the $0.2440 and $0.2420 support levels to move into a bearish zone.
The decline gained pace below a major declining channel with support near $0.2415 on the hourly chart of the XRP/USD pair. The pair is down 5% and it is now trading well below the 100 hourly simple moving average.
A new weekly low is formed near the $0.2293 level and the price is now consolidating losses. It seems like ripple is facing hurdles near the $0.2335 level, plus the 23.6% Fib retracement level of the recent drop from the $0.2477 high to $0.2293 low.
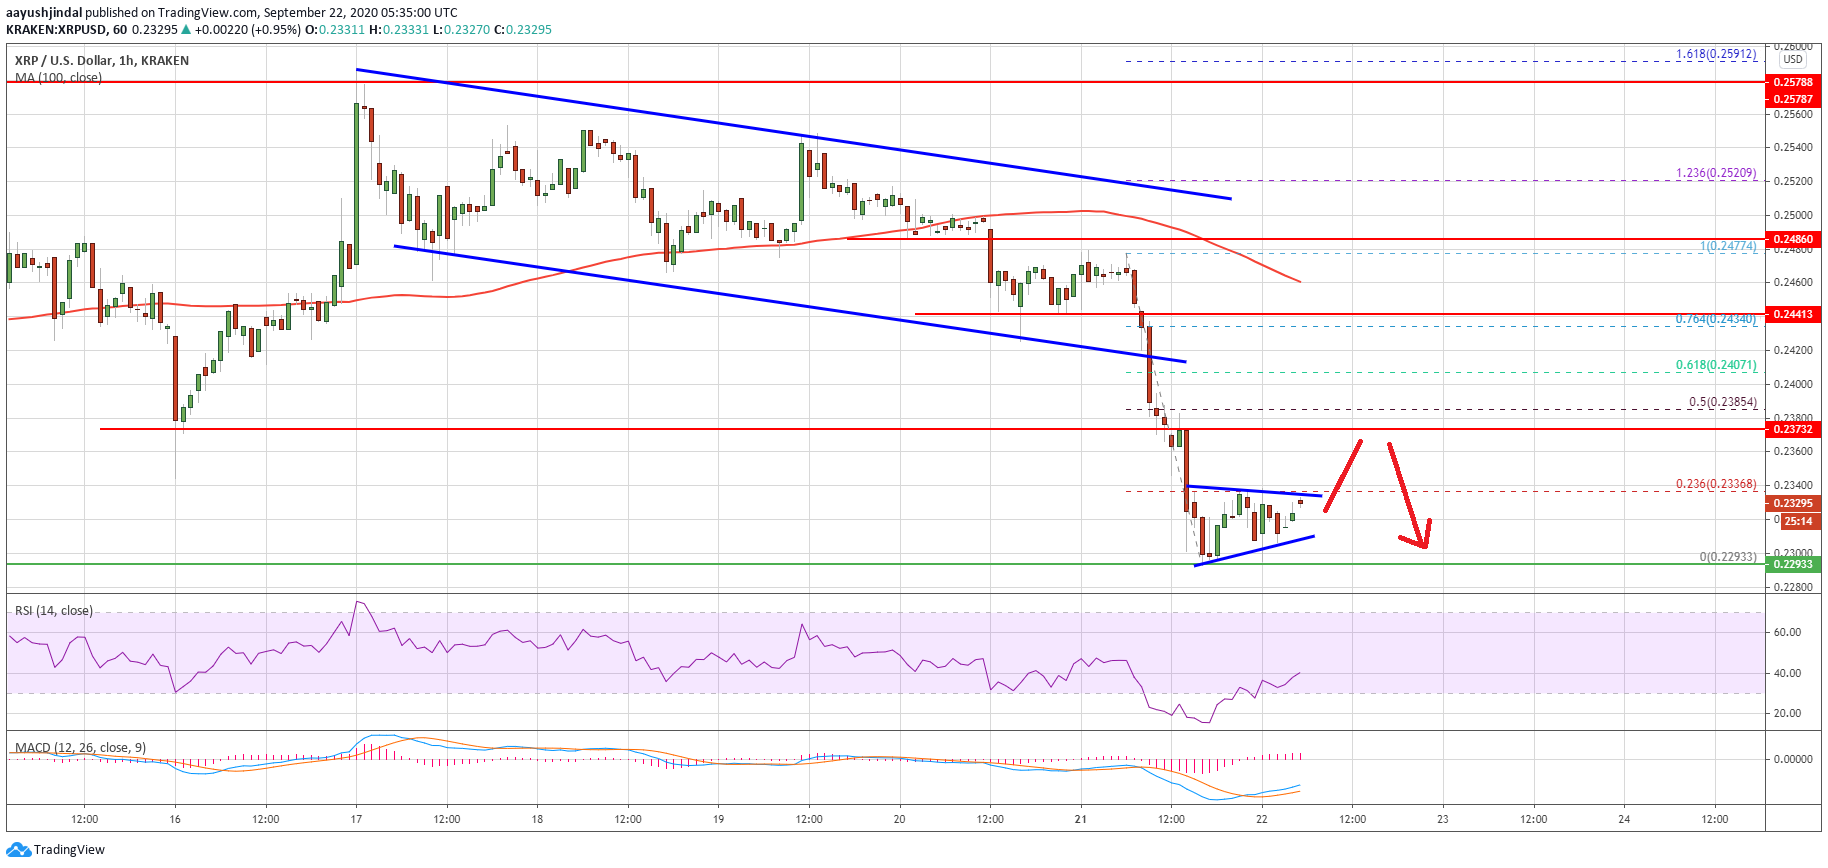
Ripple price dives below $0.2380. Source: TradingView.com
There is also a key contracting triangle forming with resistance near $0.2335 on the same chart. A clear break above the triangle resistance could lead the price towards the $0.2380 resistance zone (the previous support and now a major hurdle).
The 50% Fib retracement level of the recent drop from the $0.2477 high to $0.2293 low is also near the $0.2385 level to act as a resistance. The main resistance for a fresh upward move is near the $0.2440 pivot level.
More Losses in XRP?
If ripple fails to clear the $0.2335 and $0.2380 resistance levels, there are chances of more losses. An initial support on the downside is near the $0.2300 area.
The main support is forming near the $0.2280 level. A clear break below the recent low and $0.2280 might open the doors for a move towards the $0.2200 level.
Technical Indicators
Hourly MACD – The MACD for XRP/USD is slowly moving into the bullish zone.
Hourly RSI (Relative Strength Index) – The RSI for XRP/USD is currently correcting higher towards the 50 level.
Major Support Levels – $0.2300, $0.2280 and $0.2200.
Major Resistance Levels – $0.2335, $0.2380 and $0.2400.