
PlanB, the popularizer behind the Bitcoin S2F method, says the model predicts BTC will break $100k by this Christmas.
The Bitcoin Stock-To-Flow Model
According to PlanB on Twitter, the BTC stock-to-flow (or S2F in short) model predicts that the cryptocurrency is on its way to break $100k by Christmas.
The S2F model is a method to predict the price of an asset based on the ratio of the stock (supply) to the flow (annual production).
PlanB is commonly known as the originator of the model, which is, however, not true. The method was already used for other assets like gold or silver before the analyst only popularized it for Bitcoin.
The S2F value of an asset can show how scarce the commodity is. The model uses a formula to relate that value with the price of the asset, which in this case is BTC.
Related Reading | Ethereum Issuance Drops Below Bitcoin’s For the First Time, Why This May Lead to a New Rally
Now, here is a chart that shows the trend of BTC’s price vs what’s predicted by the model:
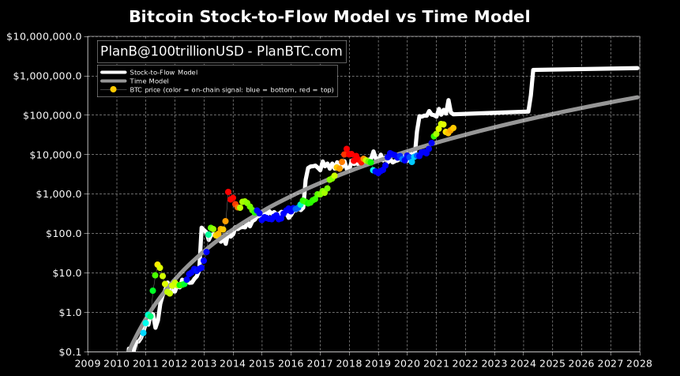
Along with the S2F model, the Time Model is also depicted | Source: PlanB
As the above graph shows, the Bitcoin price as predicted by the model seems to be remarkably close to the real thing so far.
There are a few points of deviation, but the overall trend seems to be quite similar. Now, if the price follows the pattern going forward, BTC’s value should go up soon, reaching over $100k by Christmas.
Related Reading | Stablecoins Reserve Hits A New ATH, What Does It Mean For Bitcoin’s Price?
Besides the S2F model, there is also the curve for the Time Model in the chart. This “Time Model” is a method that takes into account diminishing returns and lengthening cycles while predicting the price.
According to this other model, the price should be around $30k by Christmas. PlanB, however, believes that this method underestimates Bitcoin’s value, and the S2F model is more accurate.
BTC’s Price
At the time of writing, Bitcoin’s price floats around $47.8k, down 4% in the last 7 days. Over the past month, the cryptocurrency has increased 14% in price.
The below chart shows the trend in the coin’s value over the last three months.

BTC's price catches a downtrend | Source: BTCUSD on TradingView
After breaking above the $49k price mark again yesterday, Bitcoin has started to sharply fall down. It looks like the cryptocurrency is in a range market right now as the coin’s price continues to swing between $45k-$50k.
It’s unclear where BTC might head next, but if the S2F model holds any weight, the crypto might be moving big soon in order to reach $100k by Christmas.
Featured image from Unsplash.com, charts from PlanBTC.com, TradingView.com