
Bitcoin’s recent price action has seen it fail time and time again to break into the $10,000s. Just recently, the cryptocurrency dove 4% yet again, falling from the high-$9,000s to $9,400.
It’s consolidation under a key resistance that has had some analysts skeptical that Bitcoin will continue even higher.
Yet an eerily accurate analyst suggested that there’s a “scary” fractal predicting BTC trades at $14,000 in the coming six weeks.
Related Reading: Crypto Tidbits: $200M of Bitcoin Liquidated, Ethereum DeFi Adoption Limited, Bloomberg Is Bullish
Bitcoin Is Poised to Break Higher: Key Fractal
A fractal in financial markets is when a period of price action is seen again for another asset and/or on a different time frame. As Investopedia explains:
“Fractals also refer to a recurring pattern that occurs amid larger more chaotic price movements”
A prominent cryptocurrency trader recently identified a fractal. He argued that Bitcoin’s price action from the start of April until now looks eerily similar to a period at the end of 2016, after the previous block reward halving.
Bitcoin has traced the fractal to a T over the past few weeks, falling when it does and rallying when it does. The two periods of price action are so closely overlapped that it’s almost hard to tell where one begins and the other ends.
Should the fractal play out in full, Bitcoin will trade at $14,000 and even higher in the coming six weeks, according to the trader’s chart:
“Scary fitting fractal from EO 2016 Cut of the top part to not trigger anyone If we see anything like it… inverse capitulation becomes real,” he remarked in reference to the chart below and how crypto investors are expecting “capitulation.”
Bitcoin fractal chart shared by cryptocurrency trader Ethereum Jack (@BTC_JackSparrow on Twitter).
The Analyst’s Track Record
Some may brand the fractal as unpredictable, but the analyst that shared it has made some surprising calls over the past few months.
When Bitcoin fell around 50% in 24 hours to a price of $3,700 in March, most analysts were fearful of a collapse of the industry.
One prominent commentator suggested that there was a valid chance BTC fell under $1,000. Others followed suit, with some exiting crypto entirely.
But the analyst who shared the fractal above, literally just hours after the crash transpired, said that the bottom was in. He also said that Bitcoin was primed to see a V-shaped recovery that would bring it back to $10,000 by May or June.
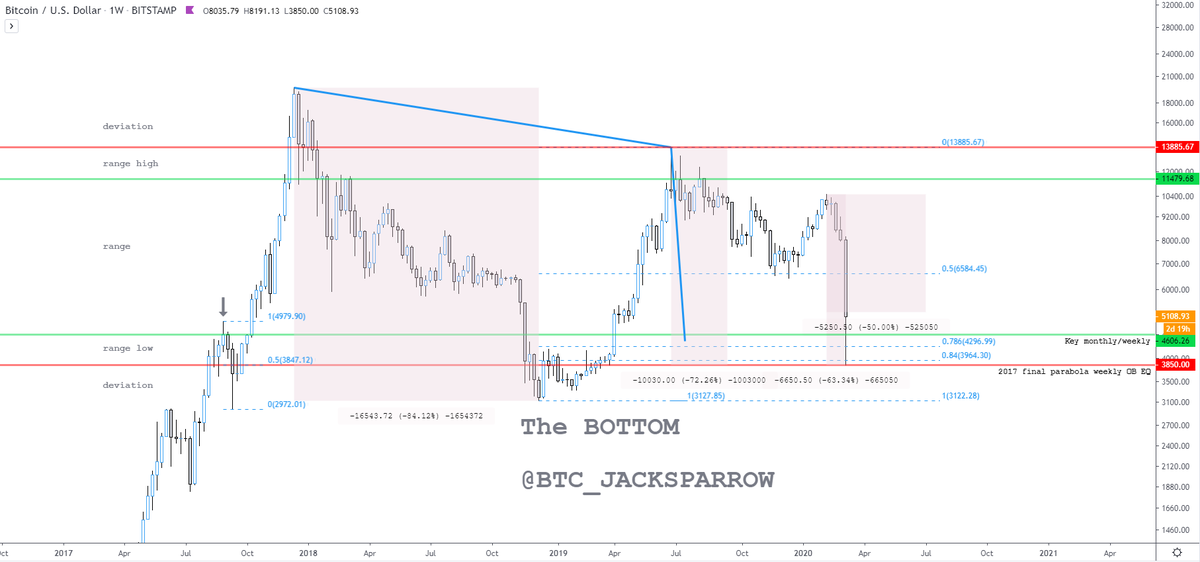
BTC chart shared by cryptocurrency trader Ethereum Jack (@BTC_JackSparrow on Twitter).
As we now know, he was right.
Bitcoin bottomed at the price he marked, then rallied in a V-shaped way to recover to $10,000 just weeks ago.
Related Reading: On-Chain Data Shows Ethereum Usage Has Rocketed, Boosting ETH’s Bull Case
Featured Image from Shutterstock
Price tags: xbtusd, btcusd, btcusdt