

- Bitcoin has pulled back after the explosion higher on Monday. The asset now trades at $10,900 as of this article’s writing, five percent shy of the local highs.
- A textbook bull pattern still predicts that BTC will hit $14,000 in the months ahead.
- This positive sentiment has been corroborated by prominent investors such as Mike Novogratz of Galaxy Digital.
Bitcoin Could Hit $14,000
According to crypto analyst Tyler D. Coates, Bitcoin just broke out of a pivotal textbook chart pattern. The chart pattern is a “bull flag,” which is formed when prices consolidate into a flag-like pattern after a strong uptrend.
Coates’ analysis suggests that this latest bull flag predicts BTC will hit $14,000 in October or slightly before that.
Then follow us on Google News!
Macro BTC price analysis by trader Tyler D. Coates (@Sawcruhteez on Twitter). Chart from TradingVIew.com
Mike Novogratz, the chief executive of Galaxy Digital, agrees with Coates’ sentiment that Bitcoin will soon hit $14,000. He told CNBC in an interview this week that the asset will breach $14,000 in the next few months, then hit $20,000 by year-end.
The ex-Goldman Sachs partner attributed this sentiment to the money printing by the central banks of the world. This is in reference to the long-held sentiment of many BTC investors that money printing boosts Bitcoin’s value.
Novogratz thinks that the money printing and other narratives are driving the adoption of Bitcoin and gold, thus leading to the recent rallies.
$14,000 Is Just the Start
Some analysts have been even more optimistic than just expecting $14,000 in the months ahead.
One trader who predicted in the middle of March that BTC would hit $10,000 by May/June (which came true) wrote the following two days ago:
“$BTC giving the cleanest breakout-retest setup I have seen in a very long time whilst each corrective wave since 4K has been vertical re-accumulation This has all characteristics for a strongly extended fifth – aside from BTC generally loving extended fifths.”
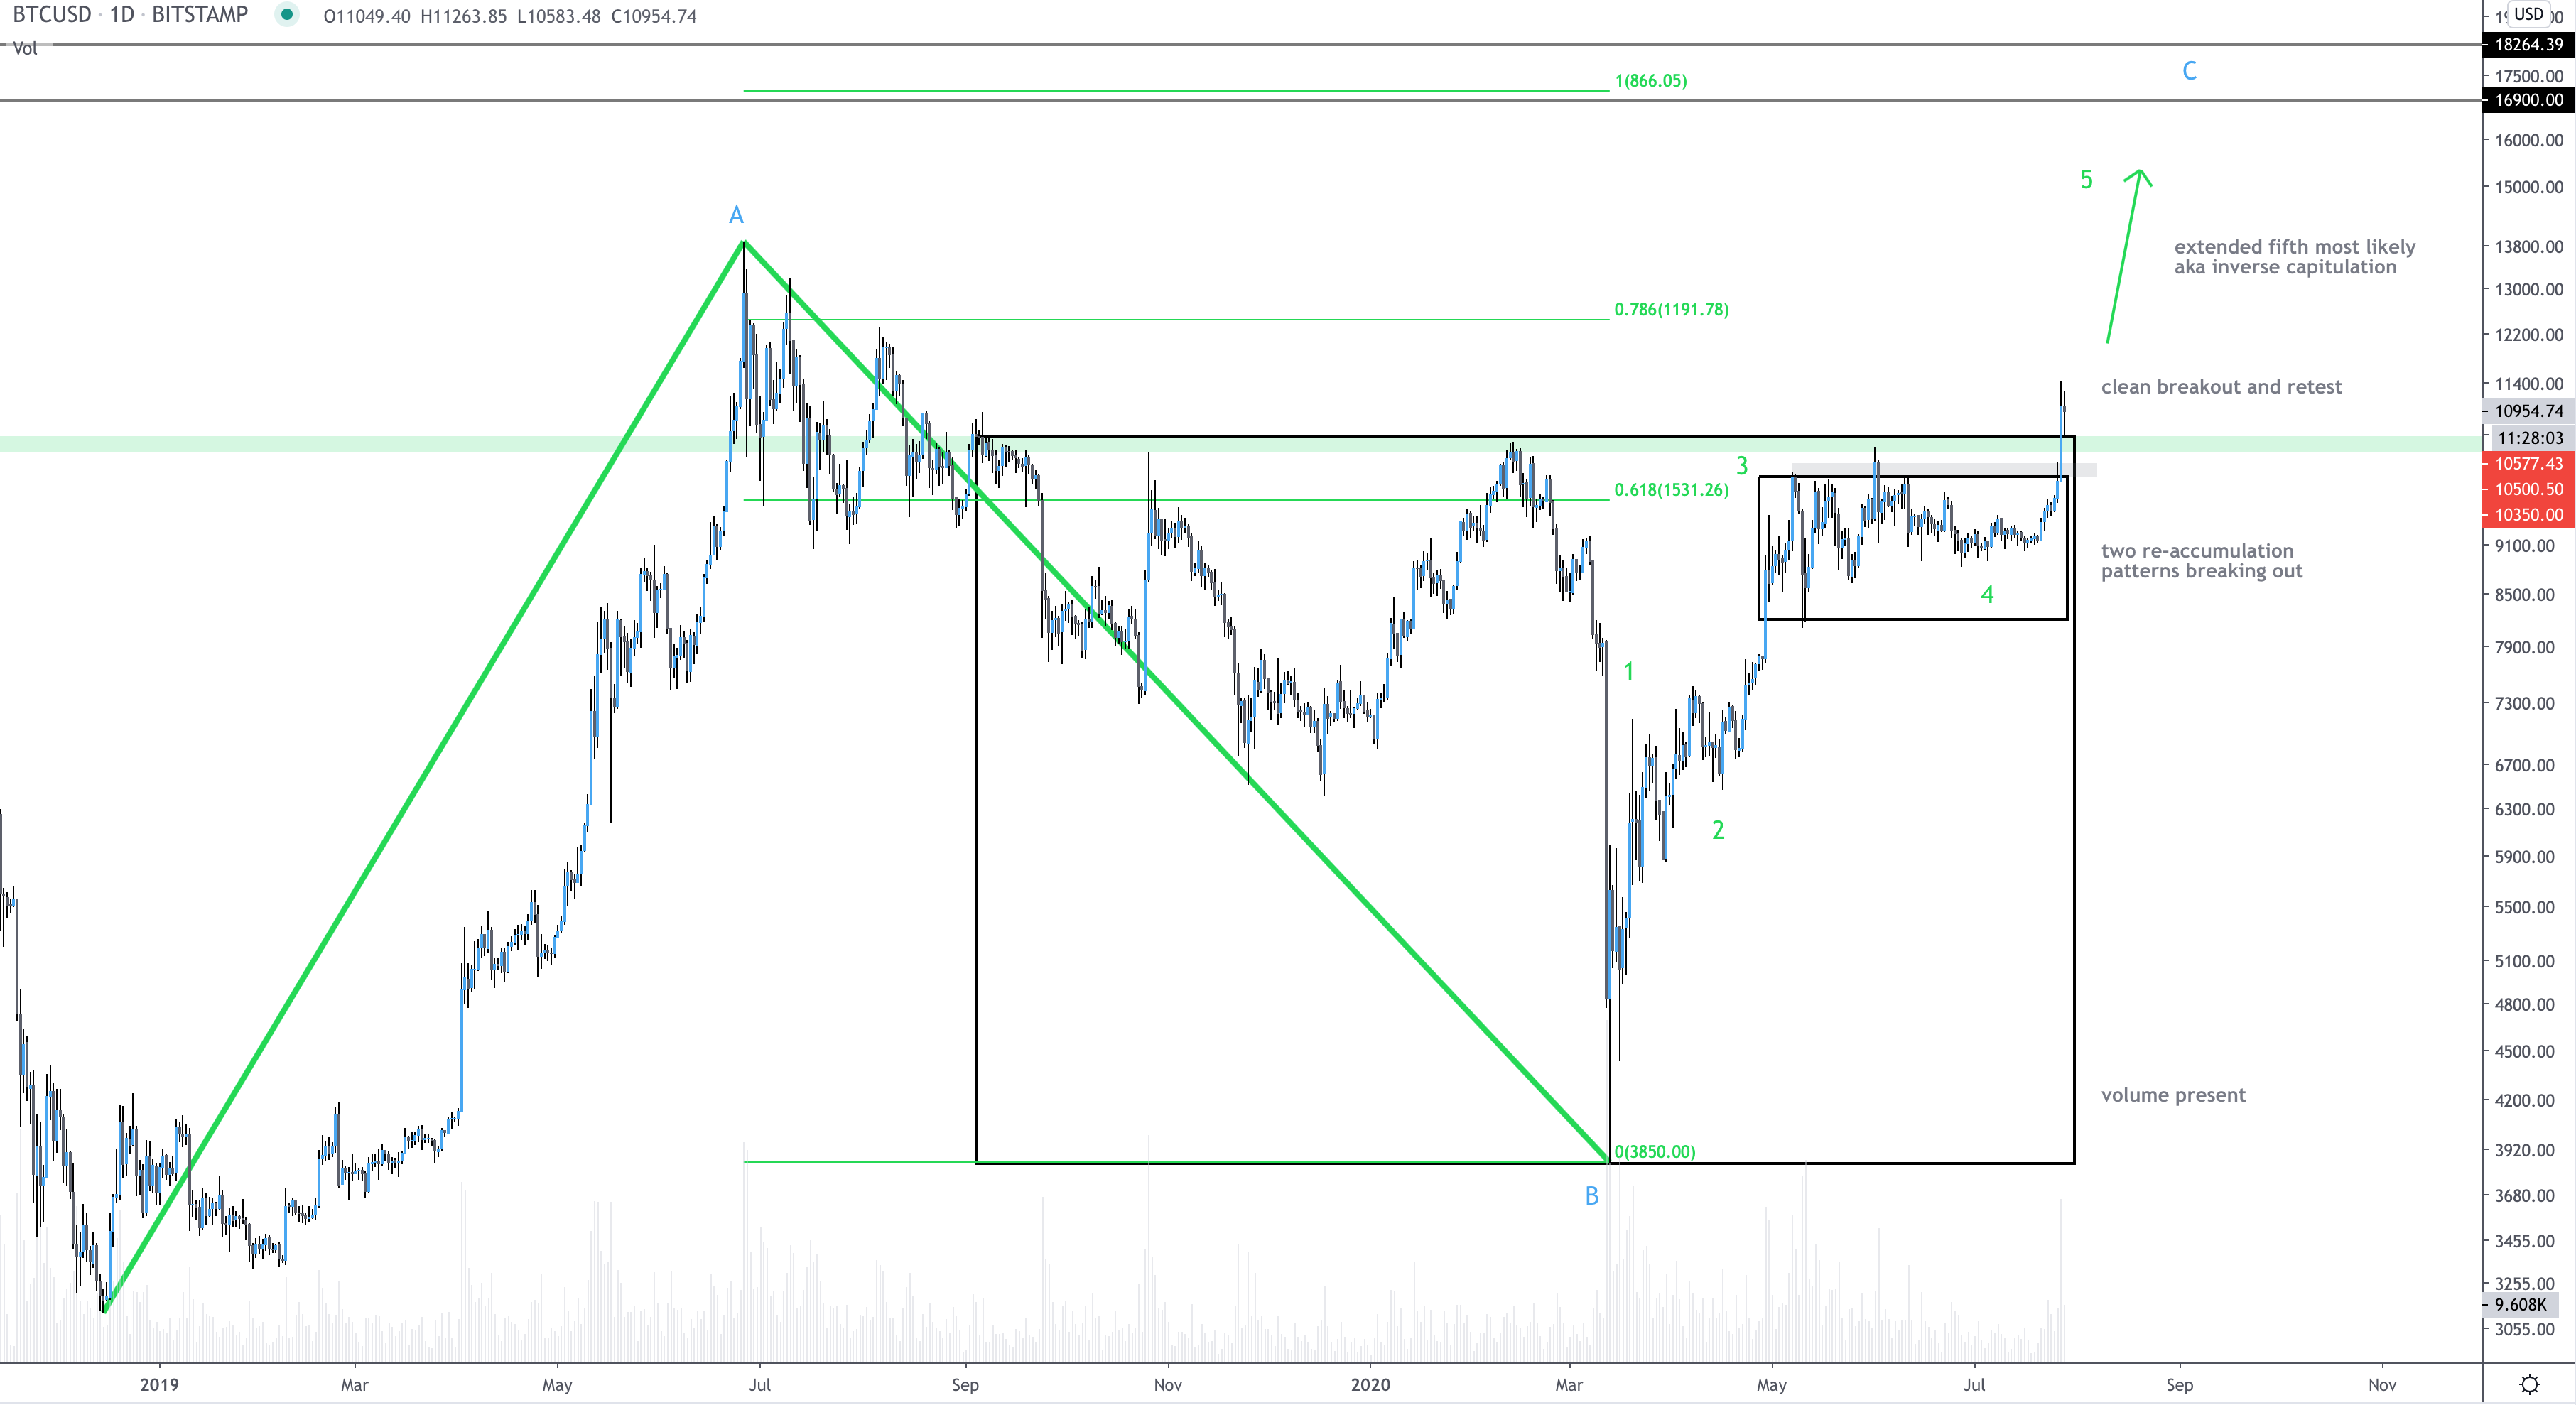
BTC price analysis by Ethereum Jack (@BTC_JackSparrow on Twitter). Chart from TradingView.com
As the chart indicates, this trader thinks Bitcoin will hit $17,000 by September or maybe even a bit earlier.
This prediction was based on an “ABC” Elliot Wave pattern. Elliot Wave is a form of technical analysis that says markets move in waves based on investor psychology. As Investopedia explains:
“Elliott Wave Theory is a method of technical analysis that looks for redcurrant long-term price patterns related to persistent changes in investor sentiment and psychology… The theory identifies waves identified as impulse waves that set up a pattern.”
It’s important to note that this same trader also thinks that after a pullback, Bitcoin will end the year around $20,000. That would mark an 80% rally from current prices.
Featured Image from Shutterstock
Price tags: xbtusd, btcusd, btcusdt
Charts from TradingView.com
Textbook Bull Pattern Predicts Bitcoin Could Hit $14,000 in October

Bitcoinist.com is author of this content, TheBitcoinNews.com is is not responsible for the content of external sites.
source: https://bitcoinist.com/textbook-bull-pattern-predicts-bitcoin-hit-14000-october/?utm_source=rss&utm_medium=rss&utm_campaign=textbook-bull-pattern-predicts-bitcoin-hit-14000-october
TheBitcoinNews.com is here for you 24/7 to keep you informed on everything crypto. Like what we do? Tip us some BAT
Send Tip now!