
The biggest question on the minds of Bitcoin investors is if the range the cryptocurrency has been stuck in will break to the upside or downside.
For almost two months now, the leading cryptocurrency has traded within a tight $1,000-2,000 range below the crucial $10,500 resistance. The chart below illustrates this well: it shows that every attempt at breaking above or below the range is rejected, resulting in BTC converging on one price region.
The price action has been so “boring” that analysts have observed that volatility indicators are tightening to levels not seen since the March crash.
The market seems rather indecisive: there are both ardent bulls and bears on social media platforms while the funding rates of futures markets attempt to converge around 0.00%.
But according to a data analyst, there’s a high chance Bitcoin breaks higher due to historical precedent.
Related Reading: Buying Bitcoin at $8k or $9k Won’t Matter in 2 Years: Fund Manager Explains
Bitcoin Has a High Chance of Breaking Higher, History Suggests
Although the price action over the past six-seven weeks has been deemed boring by most traders, it’s not uncommon for Bitcoin to consolidate as it has.
A data analyst shared the chart below on June 17th, indicating that “In the past two years, this is the 10th occurrence of $btcusd being stuck in a sub 20% range for longer than 5 weeks.”
This is relevant because a majority of these consolidation patterns have resolved upwards. “7 out of the previous 9 consolidations have led to a pump,” the analyst wrote.
That’s to say, over the past two years, 77% of the time Bitcoin looked as it does now, prices “pumped.”

The last consolidation this long, for instance, was in November to December of 2019. It preceded a pump from the $7,000 range to $10,500 in the span of two months.
That’s not to say that the current range will resolve higher, but bulls are seemingly in control with the BitMEX futures premium remaining relatively neutral as Bitcoin holds crucial supports.
It’s Potentially a Wyckoff Top
Factoring in market volume, though, some have argued that the recent price action is following a textbook top pattern.
As reported by NewsBTC previously, analyst Adam Li noted that Bitcoin’s recent consolidation matches up almost identically with the Wyckoff Distribution schematic by late technical analyst Richard Wyckoff.
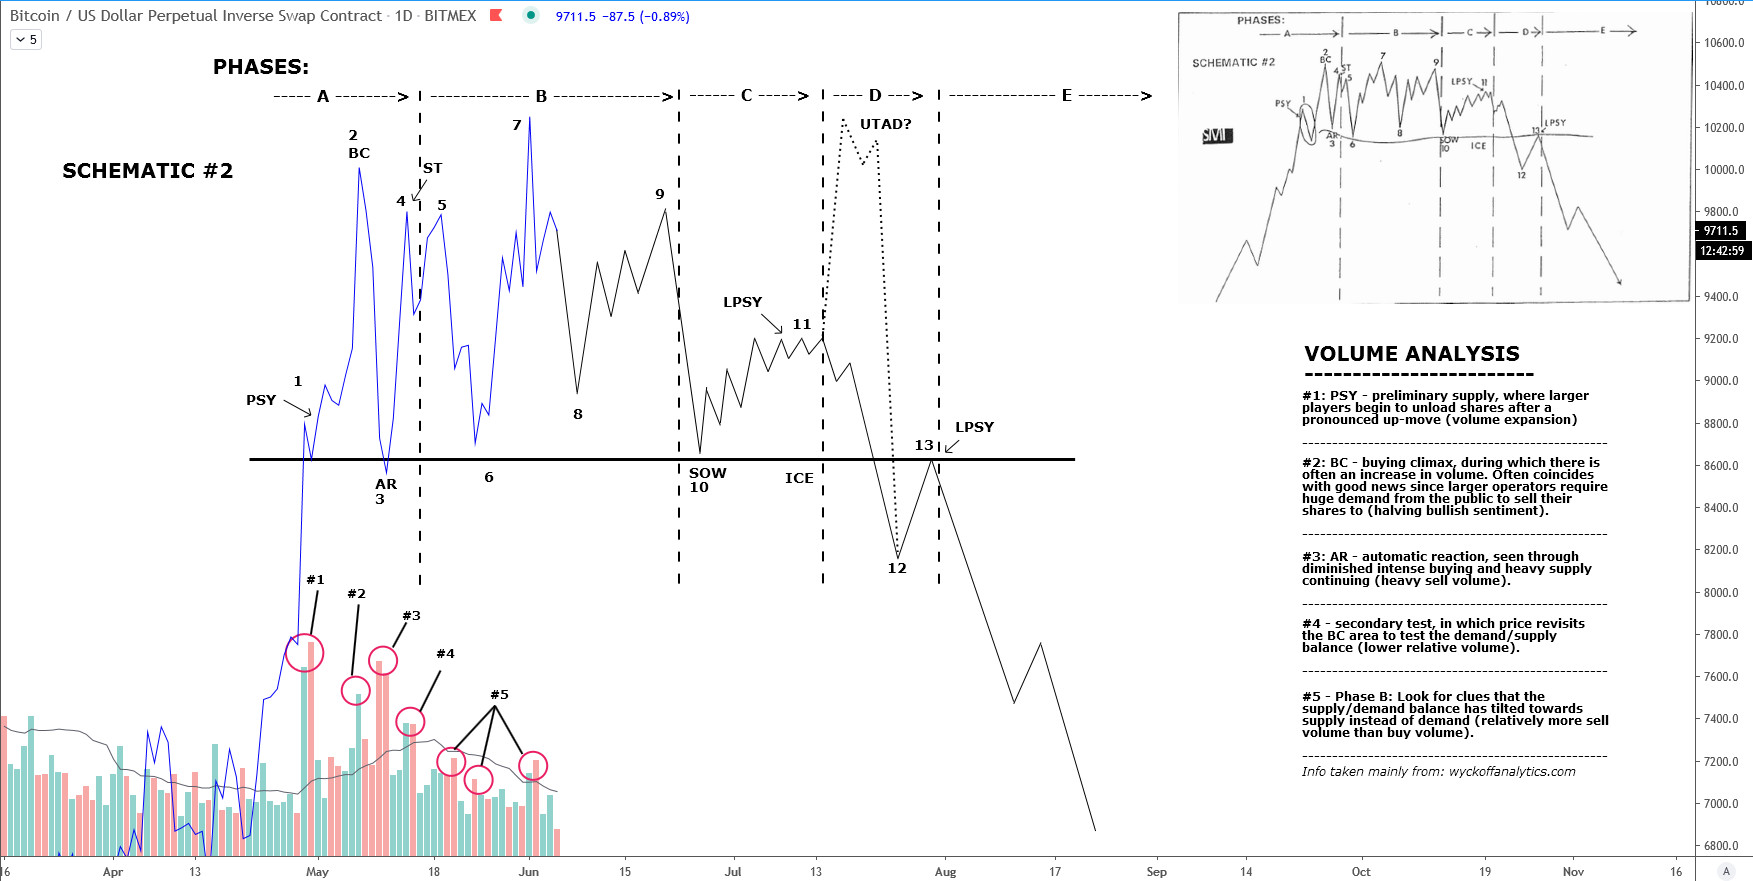
The core of the argument is centered around volume, which has been decreasing since the first ~$10,000 peak at the start of May.
There's a 77% Chance Bitcoin Surges Higher Out of Its 20% Range: Historical Analysis
Price tags: xbtusd, btcusd, btcusdt
Featured Iamge from Shutterstock