Thomas Lee’s predicted post Consensus Bitcoin pop never happened. In fact, the market reversed and is now trading at a monthly low! As usual, investors are wondering where the market will go from here.
Market Overview
Contrary to popular expectation, Bitcoin failed to rally 69 – 130% after the Consensus conference in New York ended this week. In fact, it pulled back nearly 5% as the cryptocurrency market capitalization sank to $389 billion and it appears that the downtrend is set to continue for the short term.
Fortunately, things still bode well for crypto as:
- Goldman Sachs is developing a dollar pegged cryptocurrency (USDCoin) through Circle which will finally provide an alternative stablecoin to Tether.
- As Consensus wrapped up, the CFTC and SEC directors shared their view that they have no desire to stand in the path of blockchain development.
- A platform for institutional investment in cryptocurrencies is gradually concretizing which further supports claims that institutional investors will boost cryptocurrency prices in the future.
Keeping this in mind, at present there is still more tangibly good news than bad news in the crypto-hemisphere and volatility is nothing new to cryptocurrency investors… though all of the moonshot valuations and promises of tripling market caps may have led us to forget this.
Daily Chart
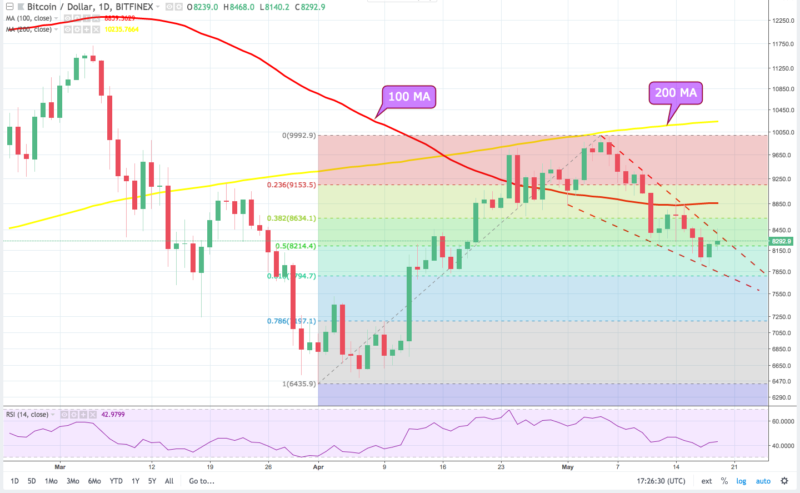
After a nearly 5% drop, BTC briefly touched a monthly low at $7,925 on Bitfinex. As shown on the daily chart, this is a nearly 50% retracement of the pre-April rally low of $6,425.
On 18th May BTC had continued a pattern of lower highs and lower lows and the daily chart shows BTC below the 100 and 200-day MA and at the time of writing the RSI sits below the 50 indicating that bears have the advantage.
4HR Chart
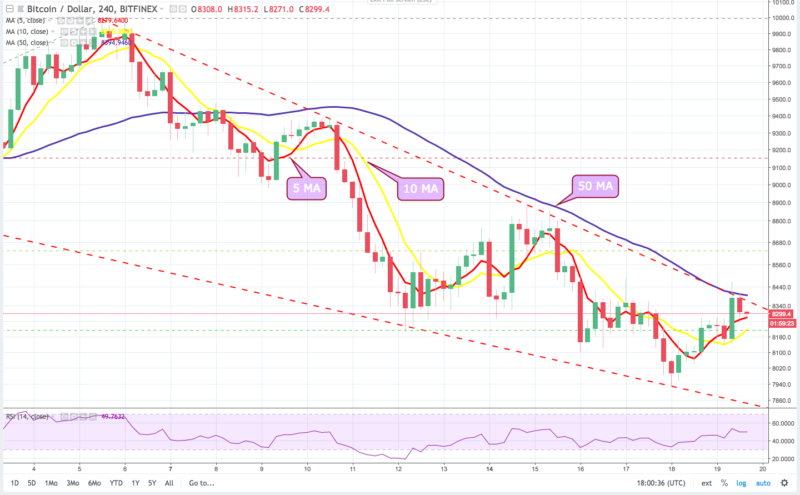
There is a smidgen of positive news for the short term as around midday Saturday the 5 and 10-day MA changed direction and BTC is close to exiting the recently developed downward channel. On the other hand, both the 20 and 50-day MA are sloping downwards and BTC needs to cross the 50-day MA at $8,400. At the time of writing BTC still trades below the 50-day MA suggesting short term continuance of the bearish trend.
If BTC is unable to recover or hold above $8,000, there are long term supports at $7,800 and $7,600 but how likely these are to hold is questionable as $7,784 is at the 61.8 percent Fibonacci retracement. A close below $8,000 means that a reversal favorable to the bears is in place and the ensuing sell off could drop prices to $7,000 or lower.
Vision
- BTC is close to crossing the 50-day MA at $8,400 and a close above the 50 would set BTC outside the recently developed downward trendline.
- Failure to recover could lead BTC to touch the $7,784 support at the 61.8 percent retracement.
- Traders are advised to watch from the sidelines as most technical indicators show bears having the advantage.
Disclaimer: The views expressed in this article are not intended as investment advice. Market data is provided by BITFINEX. The charts for analysis are provided by TradingView.
Where do you think Bitcoin price will go this week? Let us know in the comments below!
Images courtesy of Shutterstock, Tradingview.com
The post There’s no ‘Consensus’ Concerning the Direction of Bitcoin Price appeared first on Bitcoinist.com.