
After attempting to rally through $9,500 this week, Bitcoin failed to sustain its bullish momentum yet again. As of this article’s writing, the leading cryptocurrency trades for $9,200, having sustained somewhat of a pullback.
The retracement notably wasn’t caused by Bitcoin: a drop in the S&P 500 on Wednesday forced the crypto market leader.
Technical analysts, regardless, remain somewhat skeptical of BTC’s medium-term outlook.
Related Reading: Once-a-Cycle Bitcoin Bull Signal Just Appeared for the 1st Time Since 2016
Bitcoin on Track to Hit $7,000
Despite the strength seen over recent months, Bitcoin remains in a macro consolidation pattern.
A trader shared the chart below on July 9th, showing that BTC is consolidating at a diagonal resistance formed at the $20,000 all-time high. Bitcoin is also trading below the $10,500 horizontal resistance, which has been a level of importance for over a year now.
Bitcoin failing to break past these two pivotal levels will likely lead to an eventual retracement, the analyst said.
“Where are we? What’s going on? (1) Weekly. Consolidating at resistance. Until horizontal & diagonal resistance is broken, a drop to the 8ks at least & 7k is logical Can stay in this weekly triangle until Q2 2021.”
BTC analysis by trader "Michael's Trading Journal" (@MTTradJournal on Twitter). Chart from TradingView.com
Another analyst has made a similar observation, saying that the bear case he has found predicts a BTC retracement under $7,000.
The trader said that Bitcoin’s recent price action looks similar to bearish schematics shared by the late technical analyst Richard Wyckoff. Should BTC follow the schematic, it will likely trade under $7,000, the analyst said:
“A couple more clues developing that lend themselves to HTF distribution. 1. Rising Demand on the verge of failing. 2. Side by side, ascent vs descent with selling the dominant pressure from volume.”
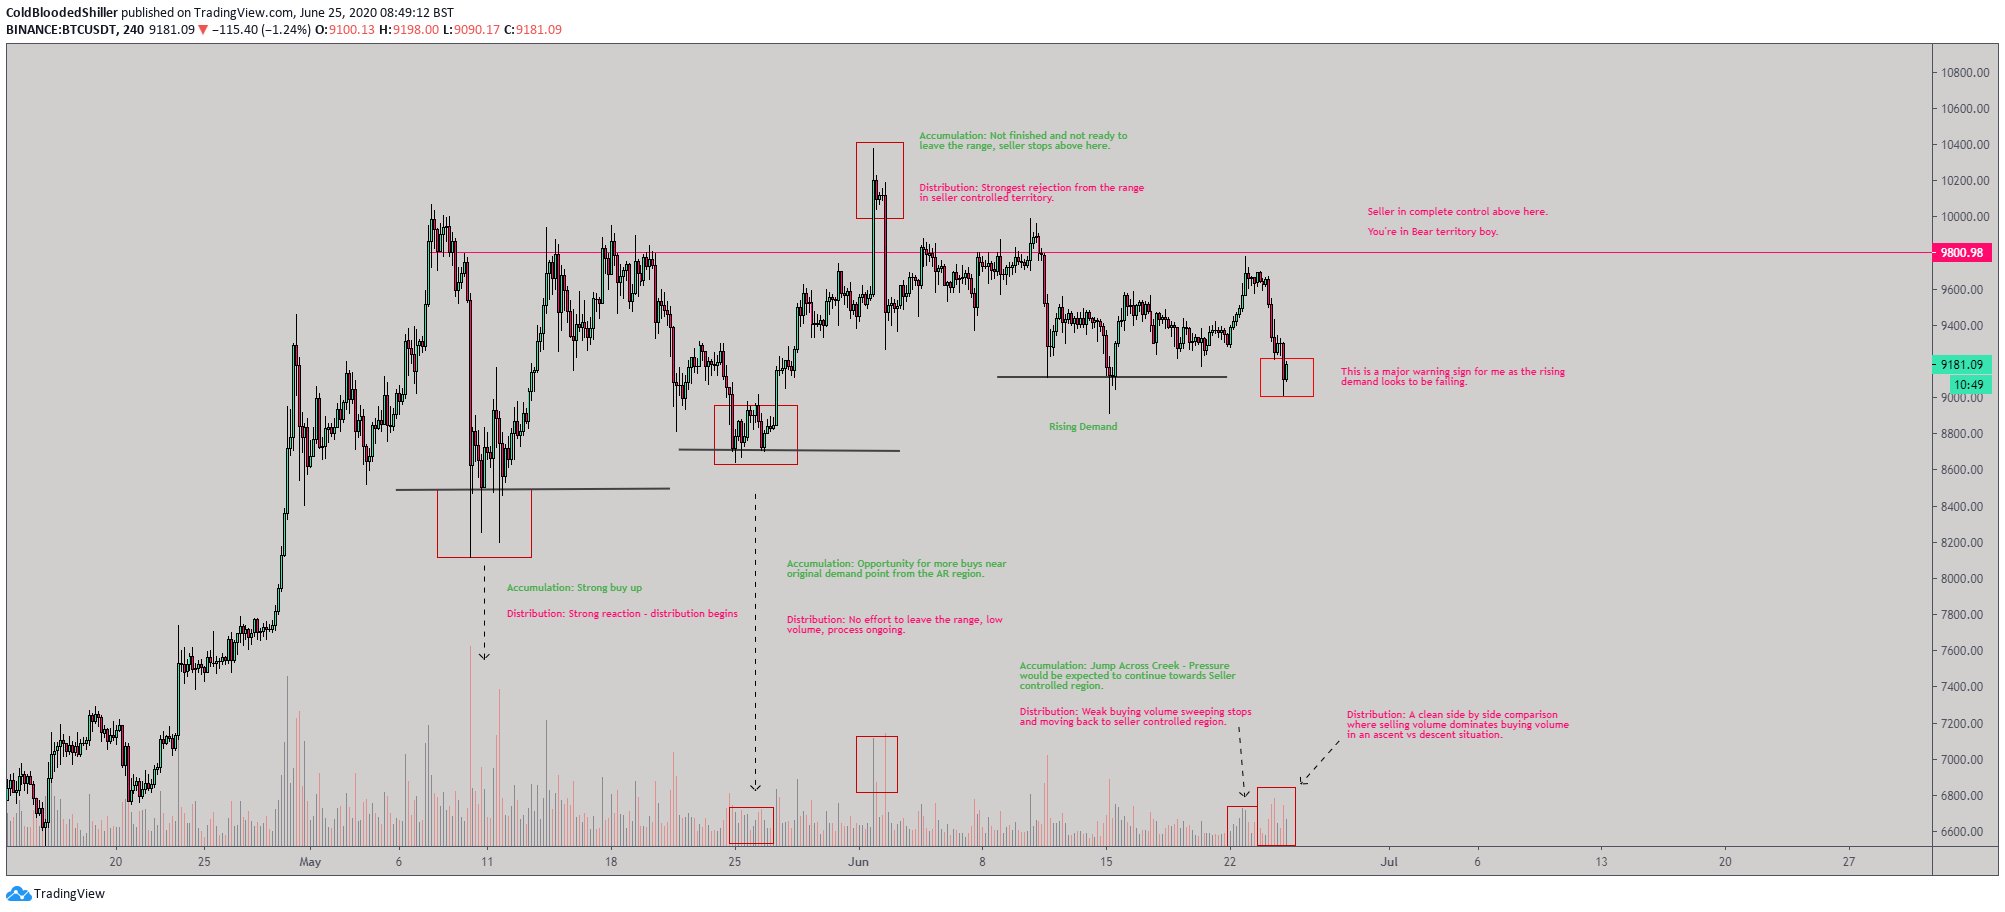
BTC distribution analysis shared by trader “Cold Blooded Shiller” (@Coldbloodshill on Twitter). Chart from TradingView.com
On-Chain Metrics Beg to Differ
On-chain metrics suggest that Bitcoin is not in distribution, but rather at the start of another bull market.
Blockchain analytics firm IntoTheBlock reports that as it stands, Bitcoin is currently in a “mostly bullish” state. Per their data, the underlying network is seeing slight growth while its in-house “concentration” indicator currently in the positive.
Bloomberg senior commodity analyst Mike McGlone has echoed the optimism. In Bloomberg’s July Crypto Outlook, the analyst wrote that increasing bTC usage is likely to result in a move to higher prices.
“The number of active Bitcoin addresses used, a key signal of the 2018 price decline and 2019 recovery, suggests a value closer to $12,000, based on historical patterns. Reflecting greater adoption, the 30-day average of unique addresses from Coinmetrics has breached last year’s peak.”
The exact level McGlone identified is $12,734, the highest price BTC closed at in 2019.
Whether or not the on-chain case will be enough to wrest BTC higher remains to be seen, though.
Related Reading: This Unexpected Metric Shows That Crypto Is in a Booming Bull Market
Featured Image from Shutterstock
Price tags: xbtusd, btcusd, btcusdt
Charts from TradingView.com
Unless BTC Breaks Through These 2 Levels, a Crash to $7,000 Is "Logical"