Weekly Recap
| Asset | Current Value | Weekly Change |
| S&P 500 | 2398 | 0.88% |
| DAX | 12675 | 1.76% |
| WTI Crude Oil | 46.47 | -5.75% |
| GOLD | 1228.00 | -3.21% |
| Bitcoin | 1570 | 16.11% |
| EUR/USD | 1.0998 | 0.91% |
Global stock markets had a surprisingly quiet week, despite Federal Reserve’s meeting and the US Employment Report, which usually cause volatile episodes all over the world. The major indices were mixed with the European exchanges outperforming their peers by a wide margin. US equities showed weakness “under the hood”, as several broad indices underperformed the leaders of the market. This divergence might be the precursor of a risk-off period, although the second round of the French election will likely be a positive influence in the first days of the week.
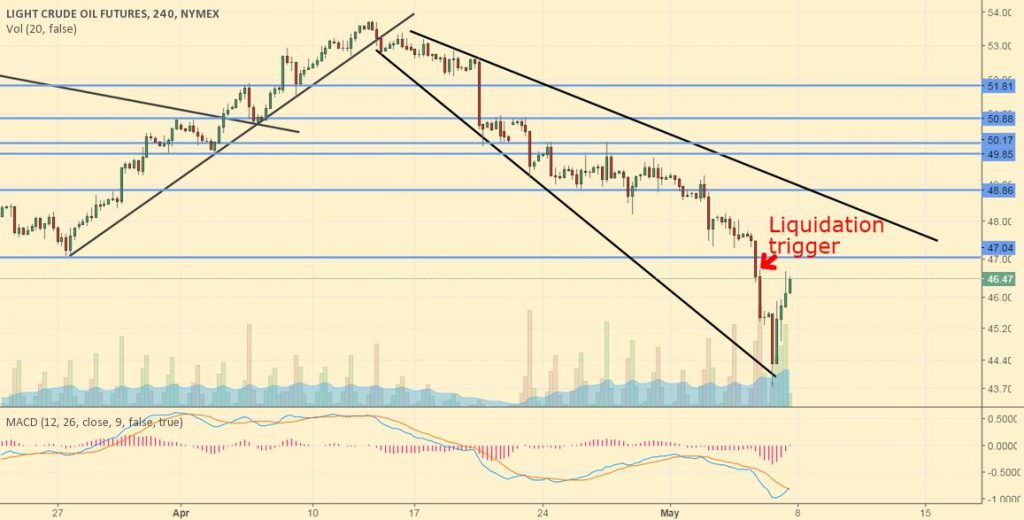
Traditional currencies were little changed amid the cryptocurrency-surge, as the Fed’s rate hike strategy seems unchanged, and the uptick in the US economic numbers halted the ongoing depreciation of the US Dollar. The Yen was among the weakest majors, while the Pound gained ground on most of its peers. Commodity currencies took a huge hit in this week, although the Canadian Dollar recovered strongly on Friday thanks to the rebound in the price of oil. Oil suffered a “liquidation-event”, as it plunged below its 5-month lows and crashed as low as $44 per barrel. Gold also fell sharply, and ended the week near the $1225 level, as the positive global sentiment hurt safe-haven assets.
WTI Crude Oil Futures, Daily Chart Analysis
Cryptocurrencies
The cryptocurrency market had a euphoric week, as the strong rally in Bitcoin and the continued surge in almost all other major coins propelled cryptocurrencies to the headlines of the mainstream media. BTC hit a high near $1600 on all of the major exchanges before entering a fierce and volatile correction towards the end of the week. The total capitalization of the market reached as high as $46 billion, an incredible 40+% jump in once week. Litecoin and Ripple were the other stars of the week, closely followed by NEM and Ethereum. Monero also performed well, while Dash and Ethereum Classic were the laggards of the period, although the latter held on well to its recent lofty gains.

Litecoin, 4-Hour Chart Analysis
Economic Numbers
The holiday-shortened week proved to be the most bullish regarding economic news in a while, with the US and British numbers providing plenty of positive surprises throughout the period. The Fed’s interest rate decision was in line with expectations, while the Employment Report was back on track, with a Non-Farm Payroll growth of 211,000 and the lowest Unemployment Rate since 2008, at 4.4%. Manufacturing PMIs were mixed globally, with the Chinese and US numbers slightly missing the consensus estimates, while the British number coming in much higher than expected.
On a negative note, the fall in commodities is suspicious for the global economy, especially after the huge Hurray following Trump’s victory. All in all, modest growth is expected to continue, although the very high level of debt in virtually all major countries, coupled by the record low level of interest rates makes the “growth story” very fragile.
Technical Corner

S&P 500, 4-hour Chart Analysis
The S&P 500 remained in a tight range throughout the week as it failed to follow through the surge of the gap of the previous Monday. This slightly negative behavior might lead to a break-down in the coming days, although a push to new highs is also in the cards following the last minute surge on Friday. The MACD indicator drifted back to neutral territory thanks to the sideways price action, with a possibly developing advancing trend-line being just below the current levels. The current pattern will likely resolve soon, and Sunday run-off in France could provide a trigger for the next directional move.
Key Economic Releases of the Week
| Day | Country | Release | Actual | Expected | Previous |
| Monday | UK | Treasury Sec Mnuchin Speaks | – | – | – |
| Monday | US | Personal Spending | 0.00% | -0.10% | 0.20% |
| Monday | US | ISM Manufacturing PMI | 54.8 | 56.6 | 57.2 |
| Tuesday | CHINA | Manufacturing PMI | 50.3 | 51.4 | 51.2 |
| Tuesday | AUSTRALIA | Base Interest Rate | 1.50% | 1.50% | 1.50% |
| Tuesday | UK | Manufacturing PMI | 57.3 | 54 | 54.2 |
| Wednesday | UK | Construction PMI | 53.1 | 52.1 | 52.2 |
| Wednesday | EUROZONE | Prelim GDP | 0.50% | 0.50% | 0.40% |
| Wednesday | US | Crude Oil Inventories | -0.9 million | -3.3 million | -3.6 million |
| Wednesday | US | ISM Non-Manufacturing PMI | 57.5 | 56.1 | 55.2 |
| Wednesday | US | ADP Employment Report | 177,000 | 178,000 | 263,000 |
| Wednesday | US | FOMC Statement | – | – | – |
| Wednesday | US | Base Interest Rate | 1.00% | 1.00% | 1.00% |
| Thursday | AUSTRALIA | Trade Balance | 3.11 bill | 3.3 bill | 3.57 bill |
| Thursday | UK | Service PMI | 55.8 | 54.6 | 55.0 |
| Thursday | CANADA | Trade Balance | -0.1 bill | 0.3 bill | -1 bill |
| Thursday | US | Initial Jobless Claims (weekly) | 238,000 | 246,000 | 257,000 |
| Thursday | US | Trade Balance | -43.7 bill | -44.9 bill | -43.6 bill |
| Thursday | EUROZONE | ECB President Draghi Speaks | – | – | – |
| Friday | CANADA | Employment Change | 3,200 | 20,000 | 19,400 |
| Friday | CANADA | Unemployment Rate | 6.50% | 6.70% | 6.70% |
| Friday | US | Employment Change | 211,000 | 194,000 | 98,000 |
| Friday | US | Unemployment Rate | 4.40% | 4.60% | 4.50% |
| Friday | US | Hourly Earnings | 0.3% | 0.30% | 0.20% |
| Friday | US | FED Chair Yellen Speaks | – | – | – |
The Story of the Week: Something Smells Fishy in China…

Long-Term Chart of the Shanghai Composite
We have been monitoring Chinese stocks in recent weeks, as the global rally since the French elections failed to ignite an advance in mainland China. In fact, the Shanghai Composite had scary declines in the wake of the crumbling of the interbank lending system, and the “shadow banking system” in the country. While this might sound technical, it is a very simple thing; the major Chinese banks are losing trust in each other and refusing to lend money to one another. Why is that? Because they fear (actually they know) that there is a huge problem in the banking system of the country.
Some experts argue that the country is in the “Mother-Of-All-Credit-Bubbles” that has been blown by the government in order to maintain growth in the country. Sure, the volume of construction projects that has been driving growth in recent years is borderline insane; and those projects were running on borrowed money, with, sometimes, very bleak return prospects. The chart above shows that non-financial credit in the country went up almost 5-times in 8 years until 2015, and that trend continued in the past year as well.
If we look around, we can see that besides stocks several related assets are showing signs of distress as well, such as commodities, commodity-related currencies, and Chinese corporate bonds. That said it’s hard to say that the bubble is popping right now, and that a US-style credit crisis is imminent. Credit bubbles tend to go on for much longer than expected even in free economies, let alone in a country which is centrally governed by people who get scared if the GDP growth rate falls below 5%.
As China expert Kyle Bass notes in this video, the re-structuring of the system is inevitable, and it will cause huge waves globally, but the timing of it is more than tricky. On another note, the coming Chinese credit crisis won’t mark the end of the China or the global economic growth, but it will be a huge bump on the road, with lots financial pain.