
As of late, it is a regular occurrence to hear suits from the mainstream media cry out for the “need for liquidity to save us.”
“But what is this liquidity that they speak of?” the average Joe may think. The ocean of monetary energy known as the U.S. dollar is often misunderstood but this “liquidity” can be the difference between hardly surviving or thriving with minimal effort. Often revolving around how close one is to freshly made supply. (Brrr).
This ocean of monetary energy may seem safe for the first world’s fish swimming inside, but there is a catch. It is not actually an ocean — there is a man-made dam keeping this value from escaping and thus keeping the fish alive. Unfortunately for everyone who enjoys safe, first-world waters with “2 percent inflation,” there are cracks showing up in the USD dam.
The faith-based concrete is starting to show the tests of time and bureaucratic ineptitude. To be fair, there has never been a fiat currency in history that has been able to stand the true test of time. The British pound is the longest-standing fiat currency, enduring a 325-year life. In the process, it has managed to leak out 99.99 percent of its purchasing power.
Unlike the British pound, the U.S. dollar is still seemingly in its glory days, often proclaimed by the financial elite as a reliable store of value due to its “low volatility” and long track history (see: wtfhappenedin1971.com). Sporting a total market cap of over $100 trillion, including various layers of money and debt instruments, it must be safe, right? At first glance, it seems safe, and if it ain’t broke don’t fix it, right? Wrong, that’s not how dam’s work.
If the structure becomes compromised, it can go from working perfectly fine to being completely broken in the blink of an eye. “Working perfectly fine” doesn’t imply being perfect, rather the black swan moment has not occurred yet to expose the cracks. Which begs the question: Is there a way to find the cracks before the dam self destructs? Maybe to try to fix it, or maybe even to find a bright orange Satoshi’s ark to survive the coming flood!
Finding The Cracks In The USD Dam
For the average Joe and Jane across the globe, there is no hope in fixing the USD dam. Luckily, we have some very skilled engineers across the world that can help us access the health of the monetary structure. A logical voice on this topic with an exceptionally high signal-to-noise ratio is none other than Preston Pysh. Well known within the Bitcoin space for his ability to diagnose financial markets, combined with knowledge from an engineering background, Pysh is a perfect first stop on this structural inspection. Back in the early days of March 2020, while the financial markets and the entire world was going crazy, Nathaniel Whittmore sat down with Pysh on his weekly podcast “The Breakdown” to record an episode titled “What Happens When Currencies Fail.” During this episode, Pysh laid out the three main factors that have historically signaled the pending failure of a currency.
“So few people understand — particularly people in academia and on Wall Street don’t understand — the fact that currencies fail, in my opinion, when three conditions are met,” Pysh said, in a slightly paraphrased way. “First: A currency that is not pegged. Second: When the government is spending at a rate that far exceeds the tax revenue. Third: The debt that’s denominated in that currency — so, for the U.S. it would be the treasury/bond market — has a yield of zero percent. When all three of these scenarios are met, you start seeing the currency underlying it all go into failure.”
As much as I believe in the Bitcoiner motto of “don’t trust, verify,” let’s take Pysh’s advice and point our magnifying glasses at these potential weak points in the USD dam in order.
A Currency That Is Not Pegged
First off, the U.S. dollar defaulted on its gold liabilities in 1971, forever to be known as the “Nixon shock.” From that day forward, the U.S. dollar was backed by nothing but the decree of the king, the definition of fiat money. It’s important to note that after the Bretton Woods Conference of July 1944 the entire global monetary system was backed by dollars, which was presumably backed by gold. This means the Nixon shock not only threw the U.S. on a fiat money standard, but did so to the entire globe. (Seriously, check out wtfhappenedin1971.com if you haven’t yet). Which means that, not only is the U.S. dollar pegged to nothing, but the entire global monetary system is pegged to nothing. This may be the reason that the entire globe is massively in debt, upwards of $250 trillion. (But to who? That’s a discussion for another day…)
When The Government Is Spending At A Rate That Far Exceeds The Tax Revenue
To continue, the second point is going to need some current and past data to try and get an idea of if the U.S. is currently spending more than it takes in and if it’s getting better or worse. The data will be sourced from the U.S. debt clock website. While not perfect, it will give us a good idea:
As seen by the numbers above, the U.S. government is spending $6.65 trillion per year, $3.45 trillion of which needed to be freshly printed due to revenue shortfalls. FYI, that’s over half if you’re not good at math.
If this was a business, this would be defined as hemorrhaging capital. Luckily for governments, they don’t play free market games, just highly-manipulated and morally-bankrupt games. On this playing field, efficiently using capital is frowned upon and there is no limit to the debt with which it is allowed to burden our future kin.
To try and get an idea if this is a flash in the pan “from COVID-19” or a sustainable problem, it’s best to look at the long-term trend of U.S. debt-to-GDP ratio. Additionally, there are liabilities that the U.S. government has accepted but currently doesn’t have the money set aside to pay for, commonly referred to as “unfunded liabilities.”
The U.S. debt clock shows the debt-to-GDP ratio actually improving from 1960 to 1980. In the 40 years since then, it has absolutely exploded, with 2008 being the black swan that greatly accelerated the problem and the COVID-19 self-induced economic suffocation being the death knell for the debt-to-GDP ratio to ever recover. Secondly, take a look at the U.S. unfunded liabilities to see if we can find some hope in making this budget conundrum work out. Turns out, politicians have promised to pay for roughly $158.9 trillion of benefits to Americans they did not set aside the money for, because obviously you can always kick the can down the road in American politics. It’s pretty safe to say that the U.S. government will be spending more than it takes in for the foreseeable future.
Debt Denominated In That Currency Has a Yield Of Zero Percent
Last but not least, it’s time to analyze how the USD and broad debt markets are looking for 2021.
It’s probably important to cover some context for anyone who is not a bond market expert. For that, I will use a simple example: Your government is offering a war bond to help fight off the invading tribe, it is offering 5 percent interest on a five-year bond. You decide to throw in your last 100 clams to help reinforce the village. For the following five years, you would go to your local town center once every three months to receive your 1.25 clams in interest. After five years of this, you go back to the town center and receive your last payment of 1.25 clams plus your initial 100. Which is when you might start asking, “Why is this interesting at all?” Bond math only starts getting interesting when you sign up for a long-term bond. This simple example will highlight why I say this.
A 30-year bond paying 1 percent interest sounds pretty crappy, right? You pay $100 and get $1 a year for 30 years. Unless, that is, the interest rates went negative. If, later that year, the market price for a 30-year bond was -1 percent, your lame investment just became a rock star.
Don’t believe me? Using a bond value calculator, it can be seen that your $100 investment is now selling for $170 on the open market. Thus making long-dated bonds by far one of the best trades and easiest money of the last 50 years. Which is when most rational people say “If bonds going negative is the only way to really make money and keep the game going, who in their right mind would buy a 30-year bond with a negative yield?!”
As much hype as the equity markets get with the Apples, Teslas and GameStops of the world, the debt market is where the biggest whales swim. The global bond market is somewhere in the neighborhood of $100 trillion (the U.S. being 40 percent of that) and the total debt markets being upwards of $250 trillion. Historically, interest rates have floated from low single digits to high teens or more based upon current financial conditions — with 0 percent interest rates having never been observed in recorded history, for obvious reasons. Never in recorded history has an investor lent out money only to get less in return, implying time has no value or, better yet, time has a negative value.
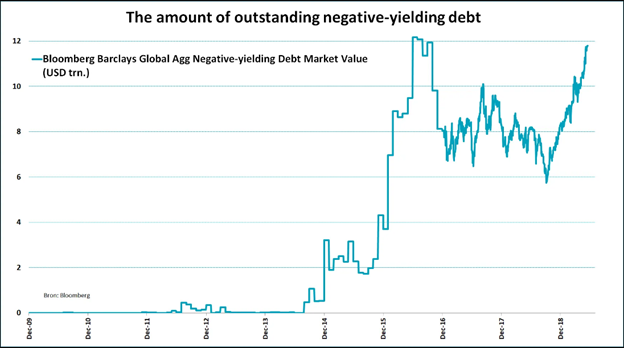
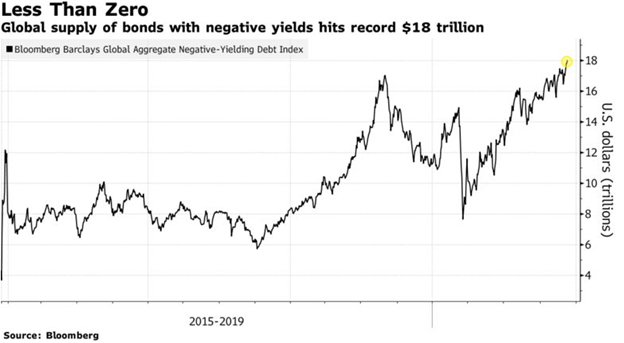
Regardless of how obvious and simple this may seem, we are at the peak of a 3,000-year bull run with negative yielding debt everywhere. Currently, the global debt with a negative yield has reached over $18 trillion. I was unable to find a single picture dating back far enough, so two were needed to show the dramatic increase over the last 10 years:
Now, it’s time to zero in on the USD. With yields across the entire curve being positive, USD is in a much better position than the majority of its monetary counterparts. With that said, 1 percent interest rates on a 10-year bond isn’t exactly wonderful considering these same bonds had a 6 percent yield just 20 years ago. So, the obvious trend is toward zero/negative.
Traditionally, the value of these bonds is calculated by taking the inflation rate (commonly measured by CPI) plus the duration risk, which goes up the longer the bond is dated for. With the price of commodities rocketing up for the first time in years due to economic difficulties and money printing, the CPI trend may just start reversing. Upon an increase in the interest rate, the entire banking and corporate establishment becomes insolvent.
So, what does the Federal Reserve do to solve this? It participates in something called “yield curve control.” This tactic would be simply described as printing money to buy any bond that trades over a certain interest rate, aka, the Fed will lock rates in at near-zero and print new money to ensure its corporate cronies and hedge fund friends are able to refinance at ever-lower rates, thus letting the purchasing power of the USD act as the relief valve to save the debt markets. Inversely, if rates keep falling without yield curve control due to economic deflation, Pysh’s 0 percent debt criteria will be hit, implying that low/negative rates are inevitable no matter what future we head into.
Upon finishing this structural inspection, it’s clear to see the USD dam has major cracks and the faith-based structure has little hope of salvation at this point. But to close things out on a brighter note, I’d like to highlight my favorite method to avoid the fallout caused by the poorly-engineered fiat monetary structures: Satoshi’s bright orange ark.
Bitcoin is a miracle of modern day engineering. Its monetary properties and foundational antifragility make it a fantastic option to help you ride out the coming instability. This decentralized network of nodes, miners and cyber hornet HODLers protect the network from all foes, 24/7/365. With even the attackers of the network adding to the strength of its encrypted hull, there is no better way to ride out the coming chaos of the USD dam breaking than stacking sats, staying humble and trying to protect your friends and family from the coming flood.
This is a guest post by Joe Dirtay. Opinions expressed are entirely their own and do not necessarily reflect those of BTC Inc or Bitcoin Magazine.