
Bitcoin price started a steady upward move from the $17,500 support zone against the US Dollar. BTC is currently attempting an upside break and it could rally above $19,000.
- Bitcoin is trading in a positive zone above the $18,500 and $18,200 support levels.
- The price is now facing hurdles near the $19,000 level, but it is above the 100 simple moving average (4-hours).
- There is a key contracting triangle forming with resistance near $18,900 on the 4-hours chart of the BTC/USD pair (data feed from Kraken).
- The pair could start a strong rally if there is a close above $18,900 and $19,000.
Bitcoin Price is Attempting Upside Break
After a steady decline, bitcoin price found support near the $17,500 zone against the US Dollar. The BTC/USD pair traded as low as $17,572 before it started a steady upward move and a recovery wave.
The bulls gained strength after the price broke the $18,000 resistance level. There was also a break above the 50% Fib retracement level of the downward move from the $19,445 swing high to $17,572 swing low. The price even broke the $18,500 resistance level.
Bitcoin is now facing hurdles near the $19,000 level, but it is above the 100 simple moving average (4-hours). There is also a key contracting triangle forming with resistance near $18,900 on the 4-hours chart of the BTC/USD pair.
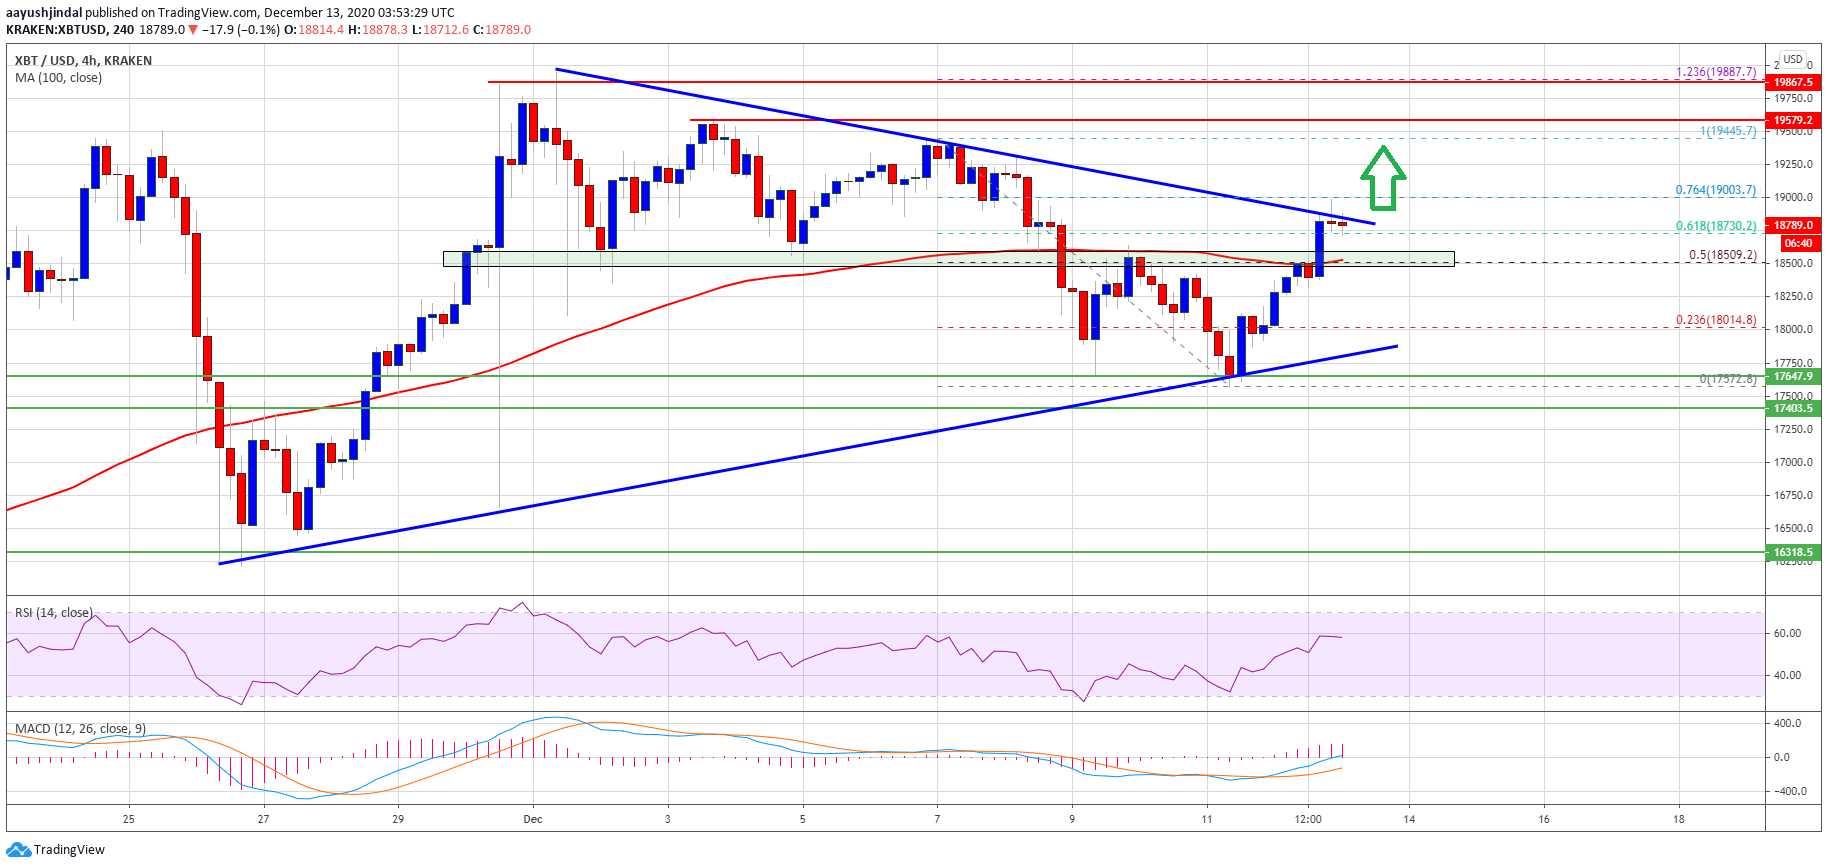
Source: BTCUSD on TradingView.com
If there is an upside break above the triangle resistance and $19,000, the price could rally sharply. The next major resistance is near the $19,500 level, above which the bulls might attempt an upside break above the $19,800 and $19,850 levels. The next major resistance sits near the $20,000 level.
Another Failure in BTC?
If bitcoin fails to clear the $18,900 and $19,000 resistance levels, it could start a fresh decline. An initial support is near the $18,500 level and the 100 simple moving average (4-hours).
The first major support below the 100 simple moving average (4-hours) is near the triangle lower trend line at $18,000. A close below the triangle support zone could open the doors for a fresh slide towards the $17,500 support zone in the near term.
Technical indicators
4 hours MACD – The MACD for BTC/USD is slowly gaining momentum in the bullish zone.
4 hours RSI (Relative Strength Index) – The RSI for BTC/USD is rising and it is above the 50 level.
Major Support Level – $18,500
Major Resistance Level – $19,000