
Bitcoin price is up over 2% and it broke the main $11,560 resistance against the US Dollar. BTC is now struggling near $11,800, but it is likely to continue higher.
- Bitcoin is gaining momentum, and it broke the $11,500 and $11,560 resistance levels.
- The price is currently testing the $11,800 resistance and it is well above the 100 hourly simple moving average.
- There is a key contracting triangle forming with resistance near $11,750 on the hourly chart of the BTC/USD pair (data feed from Kraken).
- The pair is likely to accelerate higher above $11,800 as long as it is above the $11,560 support.
Bitcoin Price Gains 2%
Bitcoin price remained stable above the $11,350 and $11,400 levels. As a result, BTC gained bullish momentum above the $11,500 and $11,560 resistance levels.
The price even climbed above the $11,700 level and the 100 hourly simple moving average to move into a positive zone. It traded to a new weekly high at $11,839 before it started a downside correction. There was a break below the $11,750 level.
Bitcoin is now trading below the 23.6% Fib retracement level of the recent rally from the $11,425 low to $11,839 high. It seems like there is a key contracting triangle forming with resistance near $11,750 on the hourly chart of the BTC/USD pair.
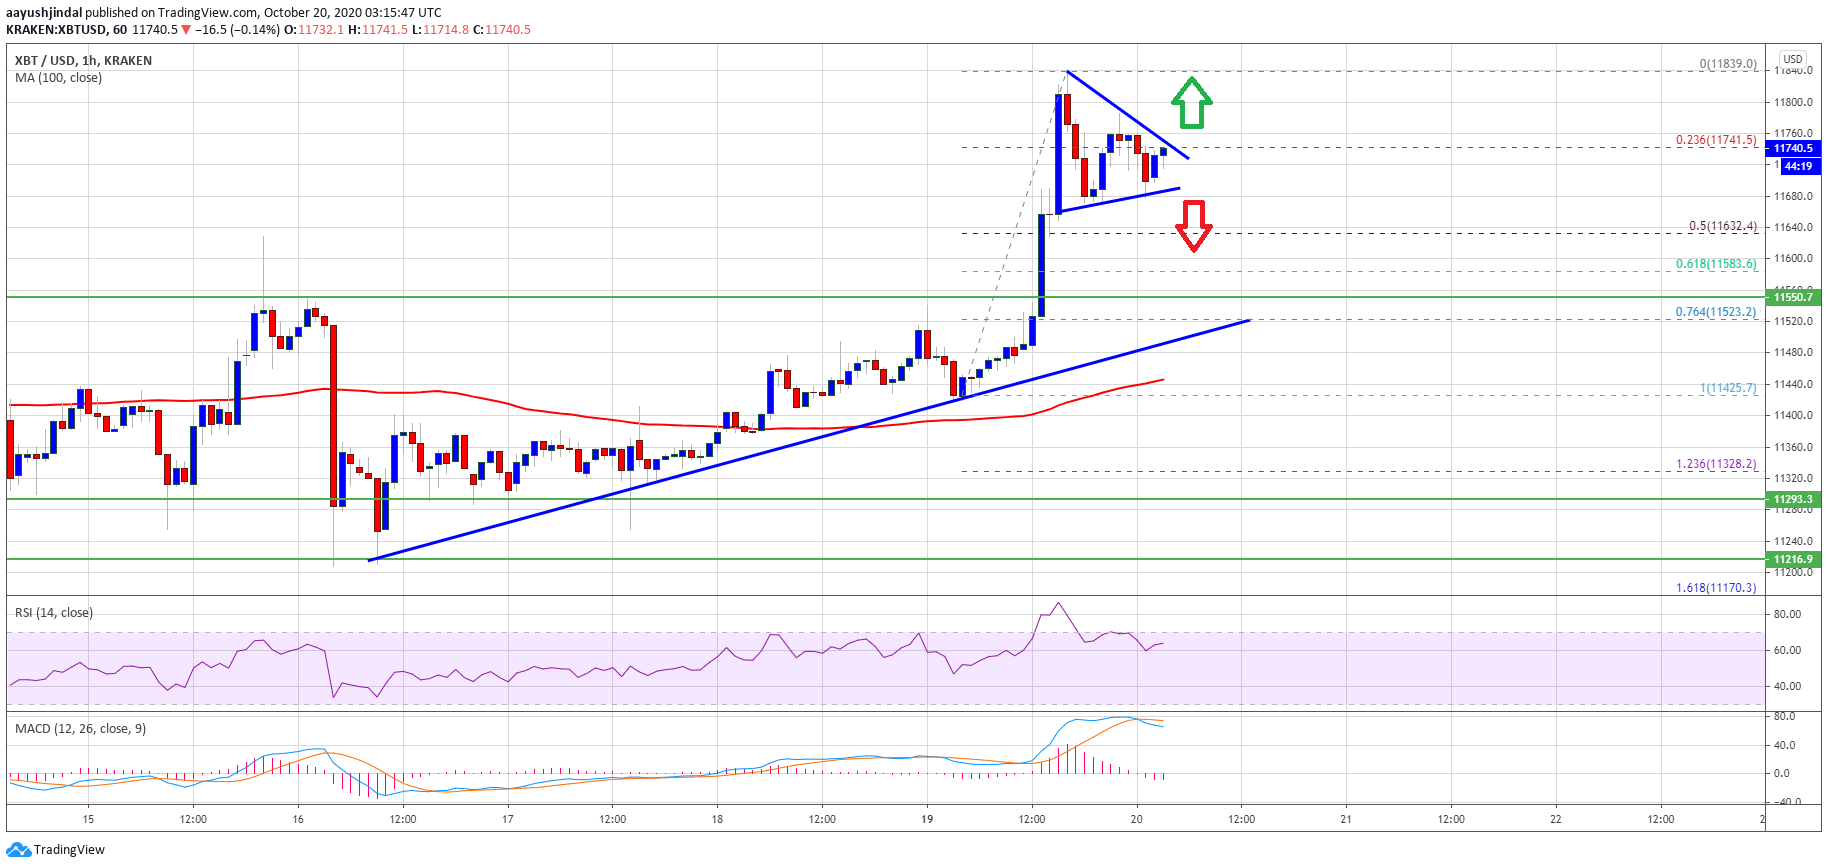
Source: BTCUSD on TradingView.com
A successful break above the triangle resistance could increase the chances of a clear break above the $11,800 resistance. In the stated case, the price is likely to surge above the $12,000 resistance level in the near term. The next major resistance is near $12,200, followed by $12,500.
Downside Break in BTC?
If bitcoin fails to gain strength above $11,750 and $11,800 resistance levels, it could extend its downside correction. The first major support is near the $11,640 level since it is close to the 50% Fib retracement level of the recent rally from the $11,425 low to $11,839 high.
The main support is now forming near the $11,560 level (the recent breakout zone) and a connecting bullish trend line on the same chart. Any further losses could lead the price towards $11,450 or the 100 hourly simple moving average.
Technical indicators:
Hourly MACD – The MACD is slowly moving in the bearish zone.
Hourly RSI (Relative Strength Index) – The RSI for BTC/USD is still well above the 60 level, with a positive angle.
Major Support Levels – $11,640, followed by $11,560.
Major Resistance Levels – $11,750, $11,6800 and $12,000.