
Ripple is following a bullish path from the $0.2780 pivot zone against the US Dollar. XRP price is currently trading above $0.2850 and facing crucial hurdles near $0.2950.
- Ripple is trading in a positive zone above the $0.2850 support zone against the US dollar.
- The price must stay above $0.2850 and the 100 hourly SMA to continue higher.
- There is a key ascending channel forming with support near $0.2850 on the hourly chart of the XRP/USD pair (data source from Kraken).
- The pair could face a strong resistance near the $0.2920 and $0.2950 levels in the near term.
Ripple Price Stable above 100 Hourly SMA
Yesterday, we saw the start of a decent increase in ripple above the $0.2780 pivot level. XRP price gained bullish momentum above the $0.2850 resistance level and settled above the 100 hourly simple moving average.
It even broke the $0.2900 level, but struggled to gain pace above the $0.2920 resistance. A high is formed near $0.2919 and the price is currently correcting lower. It broke the $0.2900 and $0.2880 levels.
There was also a break below the 23.6% Fib retracement level of the recent increase from the $0.2781 low to $0.2919 high. It is currently approaching the $0.2850 support level and the 100 hourly simple moving average.
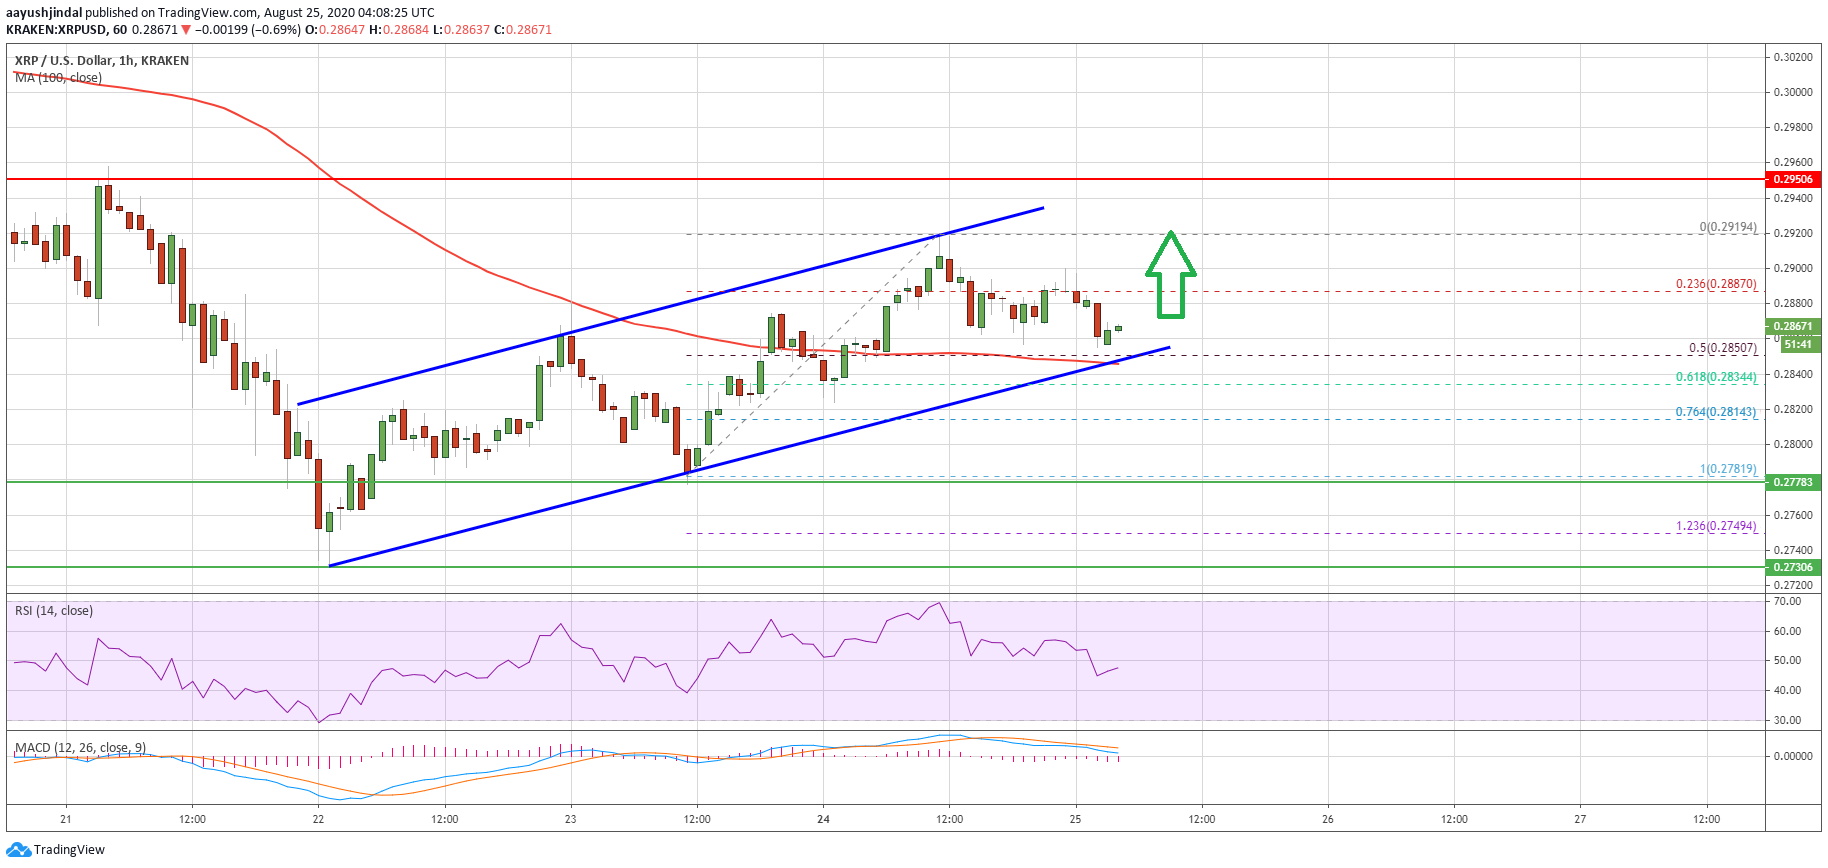
Ripple price trades above $0.2850. Source: TradingView.com
More importantly, there is a key ascending channel forming with support near $0.2850 on the hourly chart of the XRP/USD pair. The channel support is close to the 50% Fib retracement level of the recent increase from the $0.2781 low to $0.2919 high.
On the upside, XRP price seems to be facing hurdles near the $0.2920 level. The main hurdle is near the $0.2950 level, above which the bulls are likely to aim a larger upward move towards the $0.3000 barrier in the coming sessions.
Downside Break in XRP?
If ripple struggles to clear above the $0.2920 and $0.2950 resistance levels, there could be a fresh decline. An initial support is near the channel lower trend line at $0.2850.
A clear break below the channel support could push the price back towards the $0.2780 pivot level. Any further losses is likely to call for a new weekly low below $0.2720.
Technical Indicators
Hourly MACD – The MACD for XRP/USD is struggling to gain momentum in the bullish zone.
Hourly RSI (Relative Strength Index) – The RSI for XRP/USD is back below the 50 level.
Major Support Levels – $0.2850, $0.2780 and $0.2720.
Major Resistance Levels – $0.2920, $0.2950 and $0.3000.