
Ripple started a strong rise after forming a base above $0.2550 against the US Dollar. XRP price is currently rallying and it is likely to continue higher towards $0.3500.
- Ripple is up over 15% and it showing a lot of positive signs above $0.3000 against the US dollar.
- The price broke many hurdles near $0.2880 and the 100 simple moving average (4-hours).
- There was a break above a crucial contracting triangle with resistance near $0.2825 on the 4-hours chart of the XRP/USD pair (data source from Kraken).
- The pair is likely to accelerate higher towards the $0.3400 and $0.3600 resistance levels in the near term.
Ripple’s XRP Price is Gaining Momentum
In the past few days, ripple’s XRP price formed a strong support base above $0.2550 and $0.2650. As a result, the price started a strong increase and broke many important hurdles near $0.2800 and $0.2820.
There was also a break above a crucial contracting triangle with resistance near $0.2825 on the 4-hours chart of the XRP/USD pair. It opened the doors for more gains above the $0.3000 level and the 100 simple moving average (4-hours).
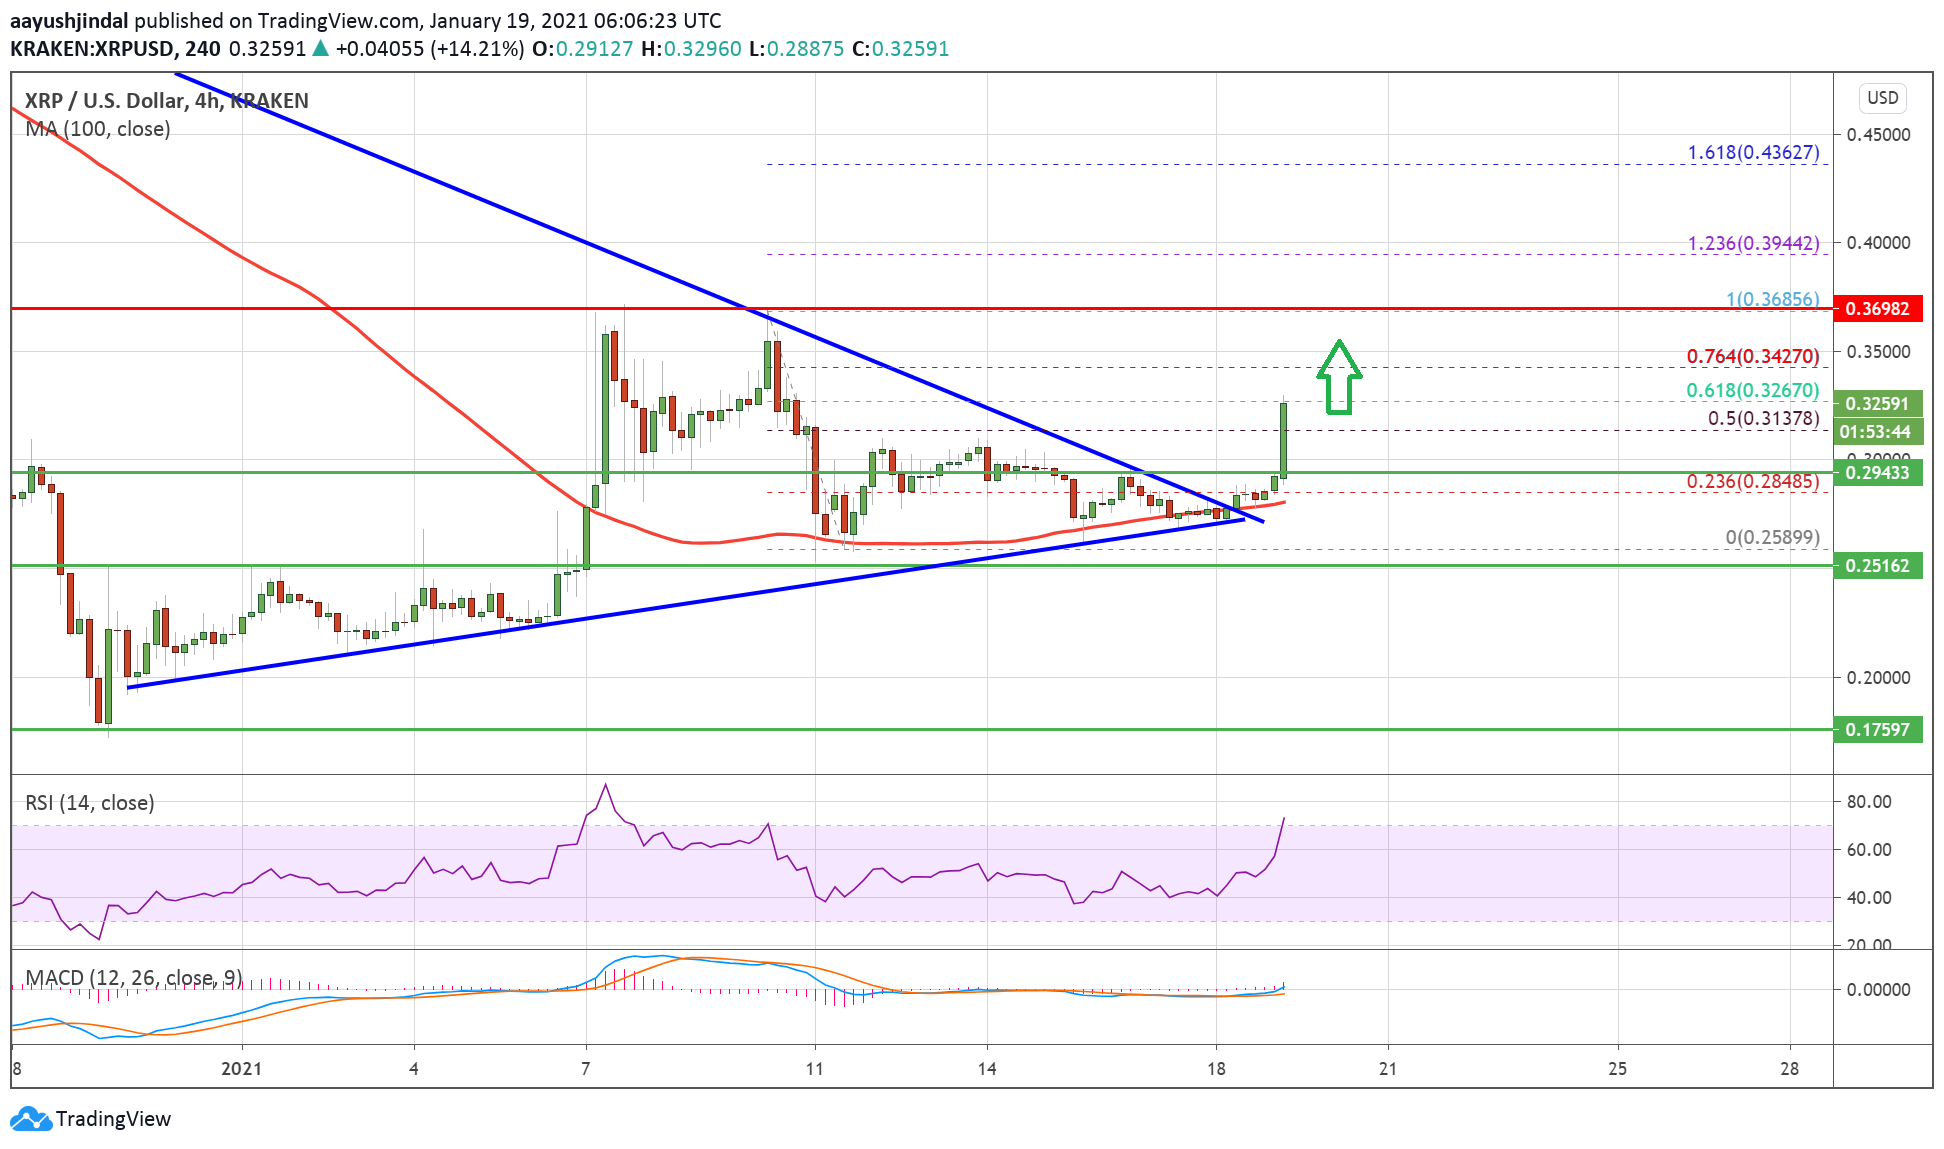
Source: XRPUSD on TradingView.com
The price cleared the 50% Fib retracement level of the downward move from the $0.3685 high to $0.2589 low. XRP is up over 15% and it outperformed bitcoin and ethereum.
An immediate resistance is near the $0.3420 zone. It is close to the 76.4% Fib retracement level of the downward move from the $0.3685 high to $0.2589 low. A successful close above the $0.3420 level could accelerate gains and the price might surge towards $0.3550 and $0.3600. Any more gains could lead the price towards the $0.4000 level.
Fresh Dips in XRP?
If ripple starts a downside correction, it could find support near the $0.3120 level. The first major support is near the $0.3000 level, where the bulls are likely to take a stand.
A major breakdown zone seems to be forming near the $0.2820 level and the 100 simple moving average (4-hours). A break below $0.2820 and $0.2800 could push the price into a bearish zone in the near term.
Technical Indicators
4-Hours MACD – The MACD for XRP/USD is gaining momentum in the bullish zone.
4-Hours RSI (Relative Strength Index) – The RSI for XRP/USD is now well above the 50 level.
Major Support Levels – $0.3120, $0.3000 and $0.2820.
Major Resistance Levels – $0.3350, $0.3420 and $0.3550.