
Binance coin has yet to see any relief as bears force price action to create a third lower low. The current market price rests of a key support line at $18.9 and will determine whether price levels drop further.
Binance Coin 1-Hour Analysis
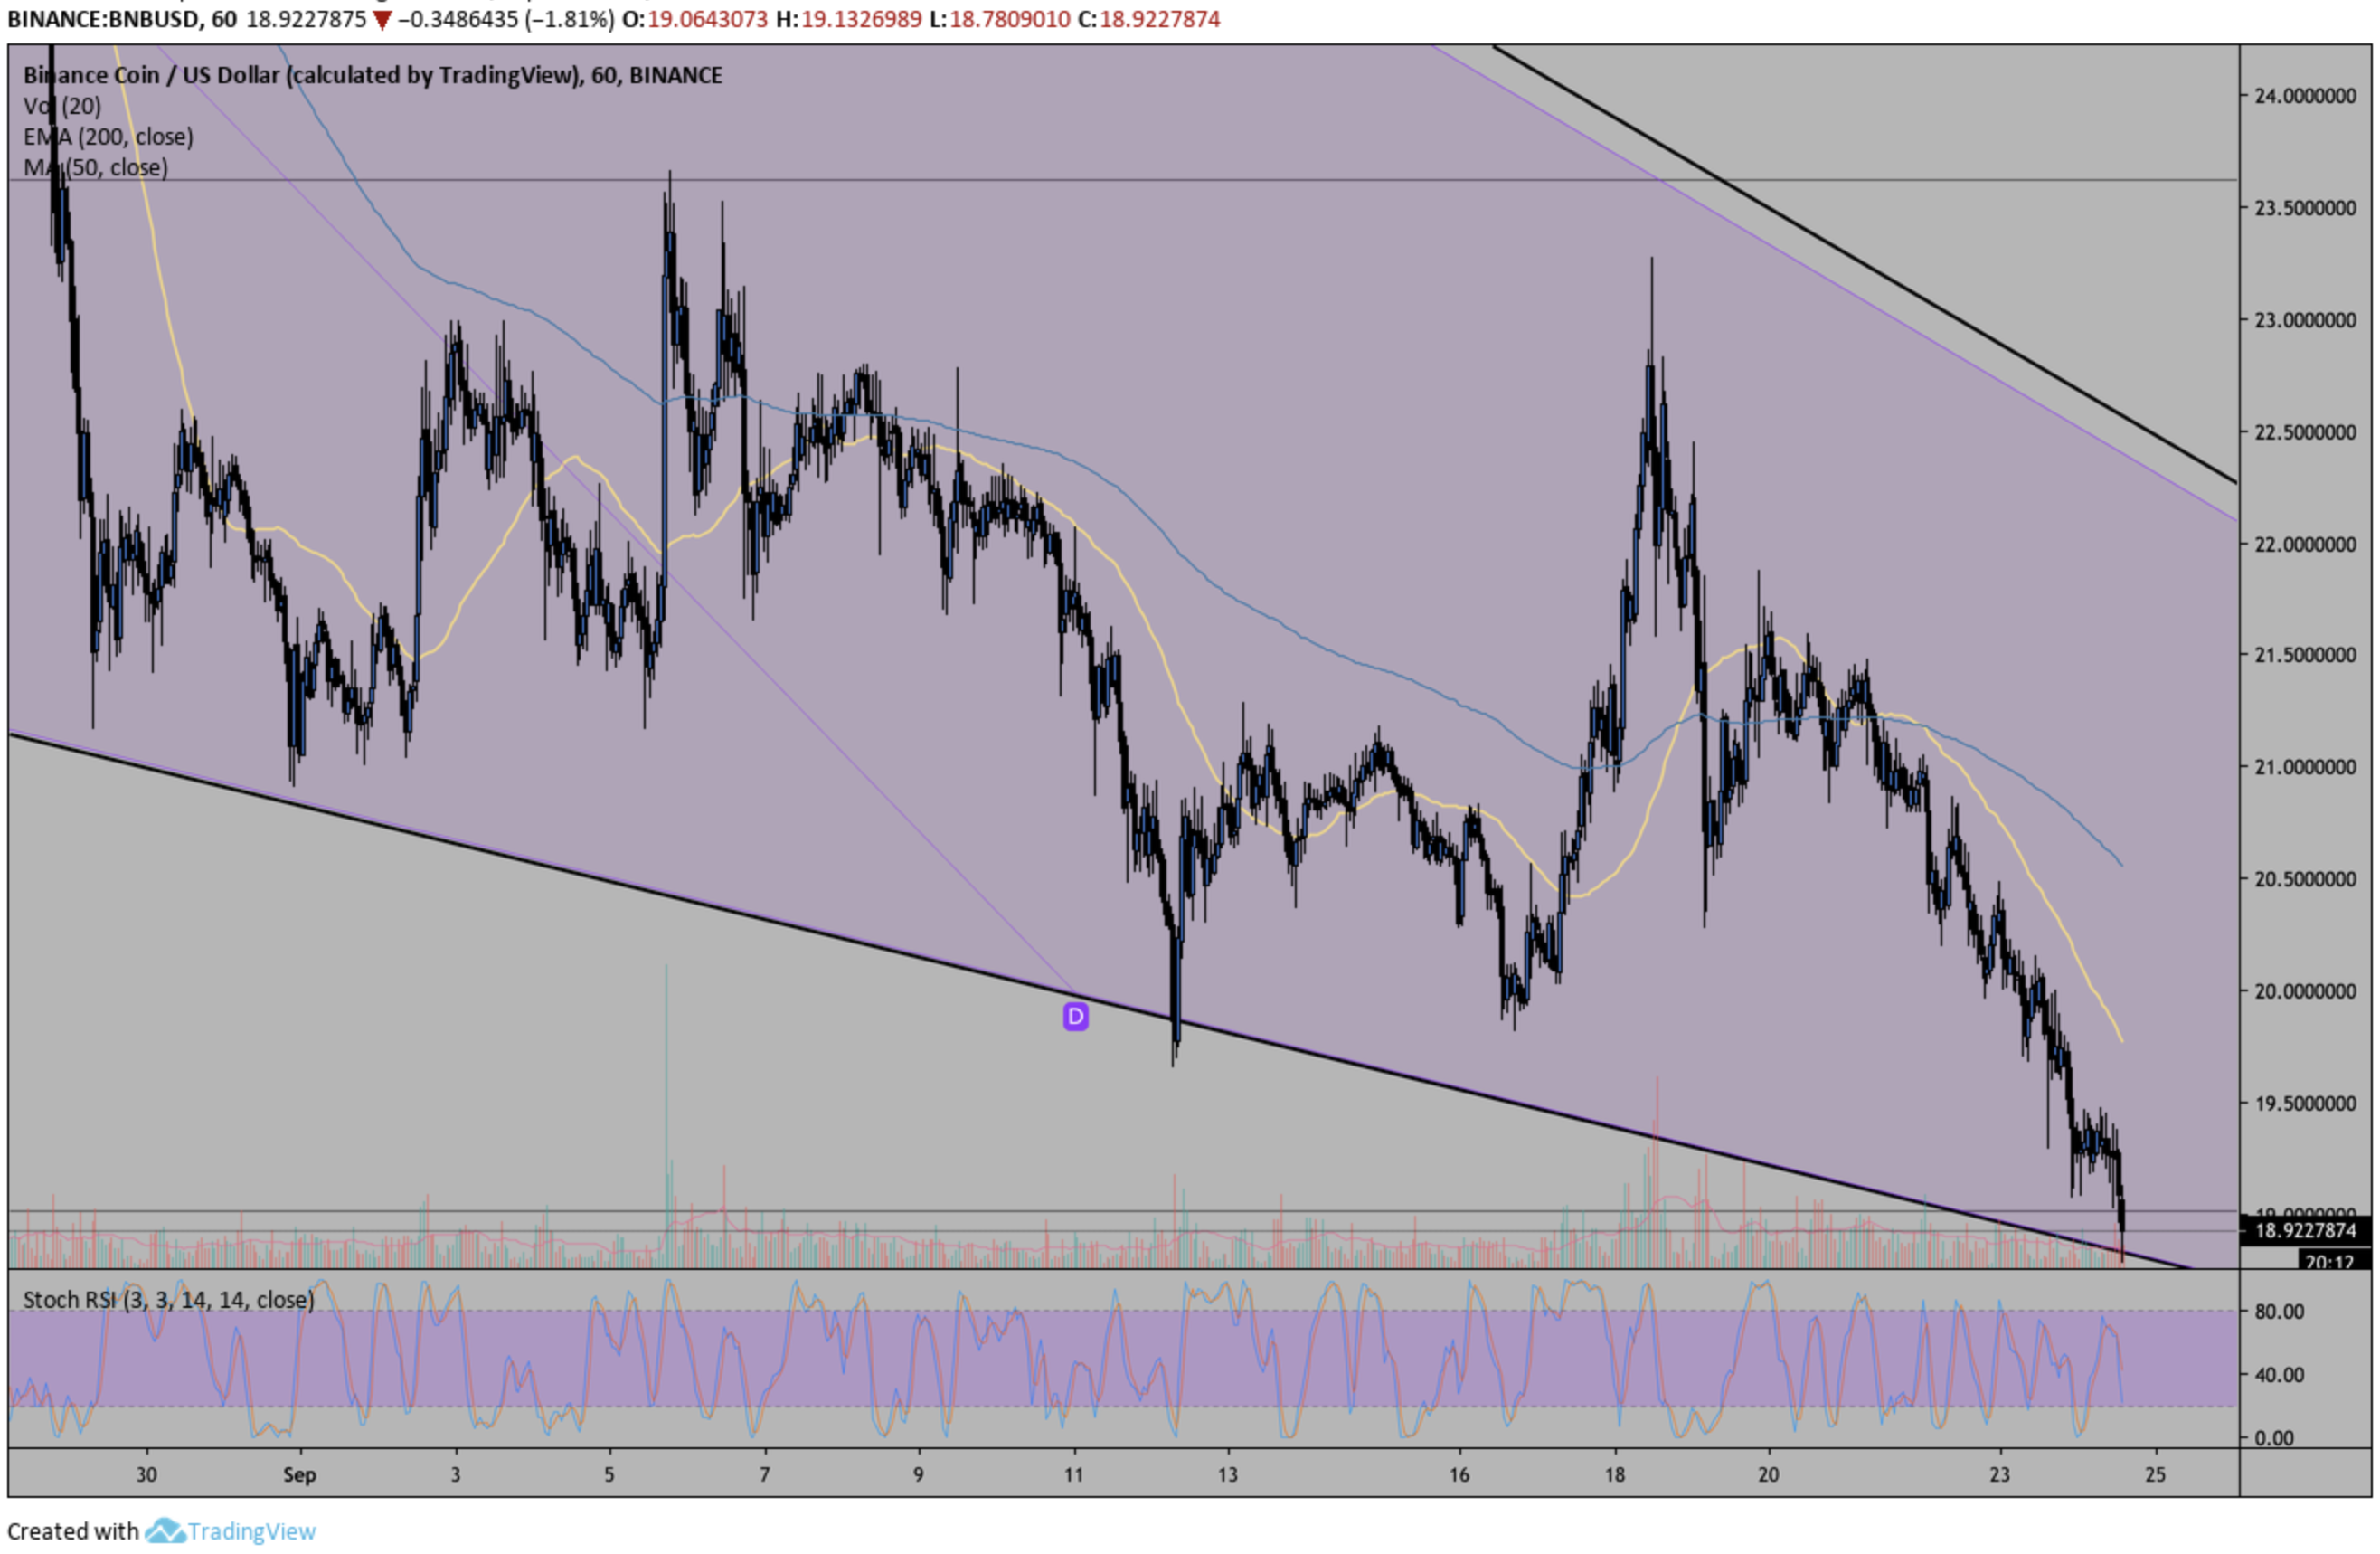
On the 1 hour chart for BNB/USD, we can see price action has created a third lower low as price levels continue to plummet as shown in my previous analysis. Binance coin has formed a falling wedge more visible on the daily chart posted below. It’s likely price levels will not break below the descending support where the current market price is testing. RSI appears to be coiling as RSI levels bounces between oversold and overbought in quick succession.
A short-term bounce off of $18.9 is expected to occur over the next few days which will propel price levels back up into the falling wedge trading range highlighted in purple. There will need to be a clear influx of additional selling volume in order for price levels to break below $18.9 which is unlikely. 200 EMA is far from the current market price and will likely act as a magnet forcing price action to bounce off of the support around $18.9.
Overall, I’m anticipating Binance coin to bounce here and continue ranging between $19 and $22 over the coming weeks.
1-Day Analysis
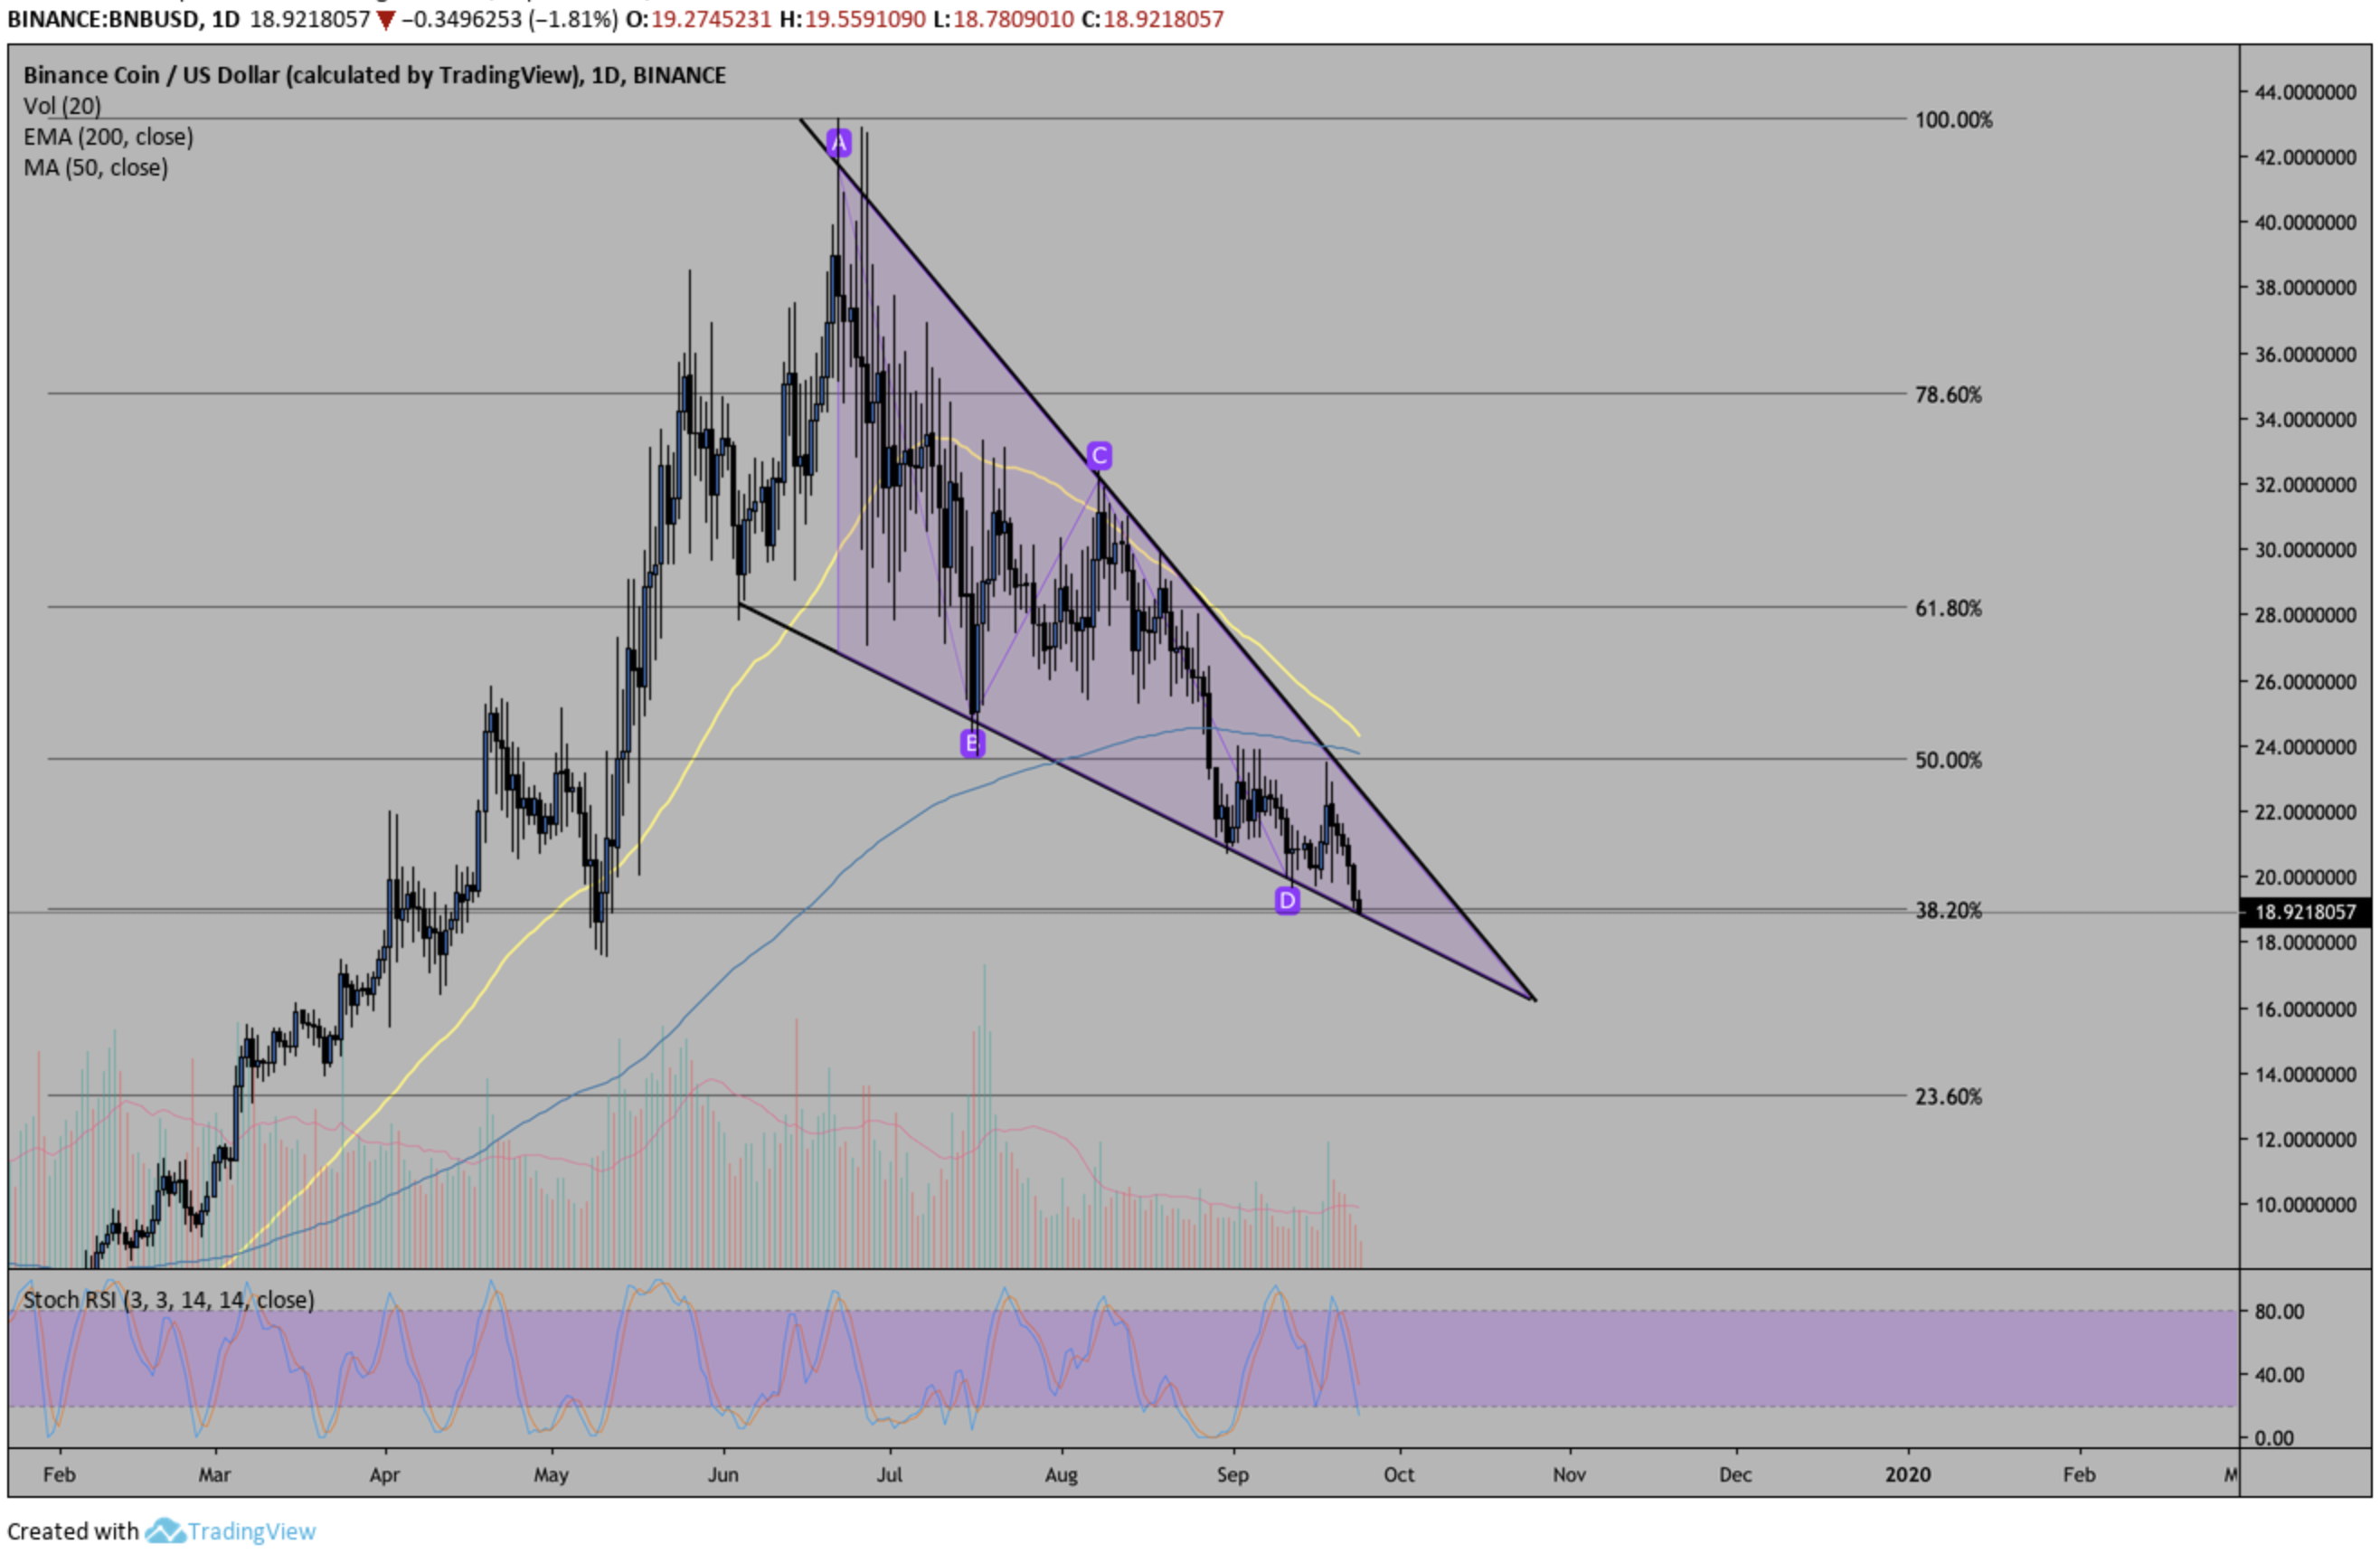
On the 1 day chart for BNB/USD, we can see the falling wedge that has formed. Stemming from the yearly highs at $43 to now the quarterly low at $18.9. Binance coin has lost 50% of it’s value over the last few months. This is nothing to worry about, many traders including myself anticipated such a pull-back in order to sustain such growth.
Both the 50 MA and 200 EMA are about to cross down signalling a bearish MA cross. However, if price levels bounce off the wedge support at $18.9 as mentioned in my hourly analysis the moving averages may not cross down in a bearish fashion. $18.9 is not only the visible wedge support but also the 38% fib level, meaning this a key level in determining the direction of BNB.
We know if price levels break below $18.9 the next real support level is around $13. This would result in yet another 20% + move the downside. RSI has yet to turn oversold, however momentum is shifting in that direction. BNB is very much in pull-back mode. The best approach to take here is to sit back and wait for reversal indicators such as a breakout of the falling wedge to the upside with a clear increase in buying momentum.
Do you think BNB will break below $18.9 support? Please leave your thoughts in the comments below!
This article is strictly for educational purposes and isn’t to be construed as financial advice.
Images via Shutterstock, BNB/USDT charts by Tradingview
The post Binance Coin Price Analysis: BNB Creates Lower and Plunges To $18 appeared first on Bitcoinist.com.