
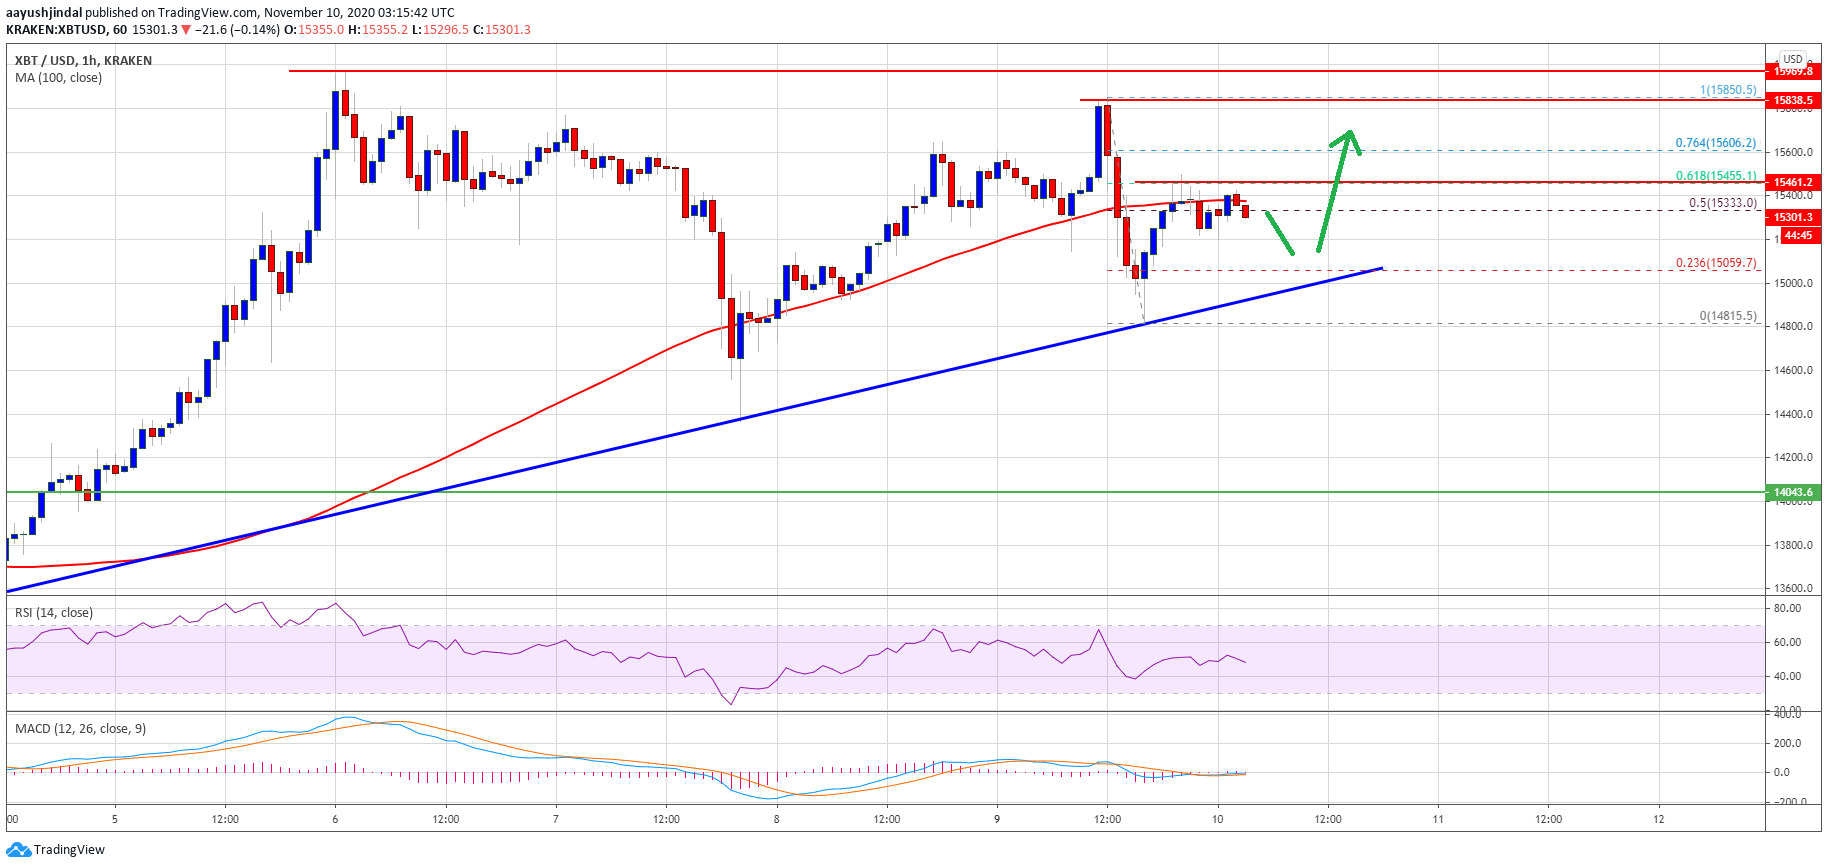
Bitcoin price is struggling to settle above $15,500 and $15,600 against the US Dollar. BTC is likely to start a sharp downside correction if it breaks the $15,000 support.
- Bitcoin is showing a few bearish signs below the $15,500 and $15,600 levels.
- The price is currently trading below $15,400 and the 100 hourly simple moving average.
- There is a key connecting bullish trend line forming with support near $15,050 on the hourly chart of the BTC/USD pair (data feed from Kraken).
- The pair could start a sharp downside correction if it continues to face resistance near $15,500.
Bitcoin Price is Facing Hurdles
There was an increase in selling pressure on bitcoin price from the $15,850 zone. BTC declined over $500 and it even spiked below the $15,000 support. A low was formed near $14,815 before the price started a fresh increase.
There was a break above the $15,100 level, plus the price traded above the 23.6% Fib retracement level of the recent decline from the $15,850 high to $14,815 swing low. However, the price seems to be facing a strong resistance near the $15,450 and $15,500 levels.
The 50% Fib retracement level of the recent decline from the $15,850 high to $14,815 swing low is also acting as a hurdle for the bulls. It is currently trading below $15,400 and the 100 hourly simple moving average.
Source: BTCUSD on TradingView.com
To move into a positive zone, bitcoin price must break $15,450 and then gain traction above $15,500. The next resistance is near the $15,600 level, above which there are real chances of a sustained upward move towards the $15,850 and $16,000 levels.
Another Downside Correction in BTC?
If bitcoin fails to clear the $15,500 resistance, there is a risk of a fresh downside correction. An initial support is near the $15,200 level.
There is also a key connecting bullish trend line forming with support near $15,050 on the hourly chart of the BTC/USD pair. If there is a clear break below the trend line support, the price might decline further below $15,000. The next major support is near $14,850, below which the price might revisit $14,500 in the coming sessions.
Technical indicators:
Hourly MACD – The MACD is struggling to gain pace in the bullish zone.
Hourly RSI (Relative Strength Index) – The RSI for BTC/USD is moving lower towards the 40 level.
Major Support Levels – $15,200, followed by $15,000.
Major Resistance Levels – $15,450, $15,500 and $15,600.