
Bitcoin saw a notable overnight rally that allowed it to move as high as $7,300, with this coming about after an extended period of trading sideways within the lower-$7,000 region for the latter part of this past week.
It now appears that bulls are targeting a movement towards $8,000, as resistance could be weakening as bulls begin mustering up further strength.
This also comes as bulls attempt to surmount a historically significant moving average that could prove to be the impetus for BTC’s next major uptrend – should bulls successfully push past it.
Bitcoin Pushes Higher as it Shows Signs of Seeing Further Momentum
At the time of writing, Bitcoin is trading up just over 2% at its current price of $7,230, which marks a slight climb from daily lows of $7,050 that were set during the bout of consolidation seen yesterday.
This climb, although relatively small in dollar-terms, is significant from the standpoint of the crypto moving past its first near-term resistance level at $7,200 – as this is where bulls faced multiple harsh rejections at throughout the past several days.
One interesting observation from a popular pseudonymous Twitter analyst is that Bitcoin’s inverse chart seems to paint a highly bullish situation for the crypto, with a target existing at $8,000.
“Bitcoin daily inverse chart makes a compelling case for the upcoming $8000 test,” he noted while pointing to the below chart.
Image Courtesy of Big Cheds
Some traders and investors believe that inverse charts can provide a unique insight into an asset’s technical situation, as they erase bias and help you view the asset with a different perspective.
While looking at the chart the analyst references, it does appear that Bitcoin is poised to move towards its 200-day moving average that exists at roughly $8,000.
BTC’s Reaction to This Key Technical Level Could Spark the Next Major Uptrend
Bitcoin’s potential push to its 200-day moving average also comes as the crypto begins attempting to flip its 89-day ema, which is a historically significant technical level that has determined previous trends.
Another analyst pointed to this level in a recent tweet, explaining that it has been resistance for BTC for 6 weeks now.
“Never underestimate the impact of the 89ema on the greater trend. It has a history of being an incredibly relevant support and resistance level – any bounce/rejection from it has huge consequences on the direction. Currently has been resistance for nearly 6 weeks,” he explained.
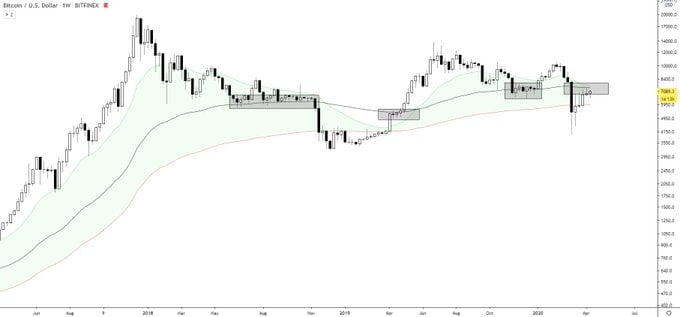
Image Courtesy of Teddy
Featured image from Unsplash.