
Bitcoin’s volatility has drastically decreased over the last few weeks as price action unfolds close to key support at $9,400. This key support line creates the bottom of the asymmetrical triangle stemming from $14,000 down to $9,400 mentioned in a previous analysis on Bitcoin.
Bitcoin 1-Hour Analysis
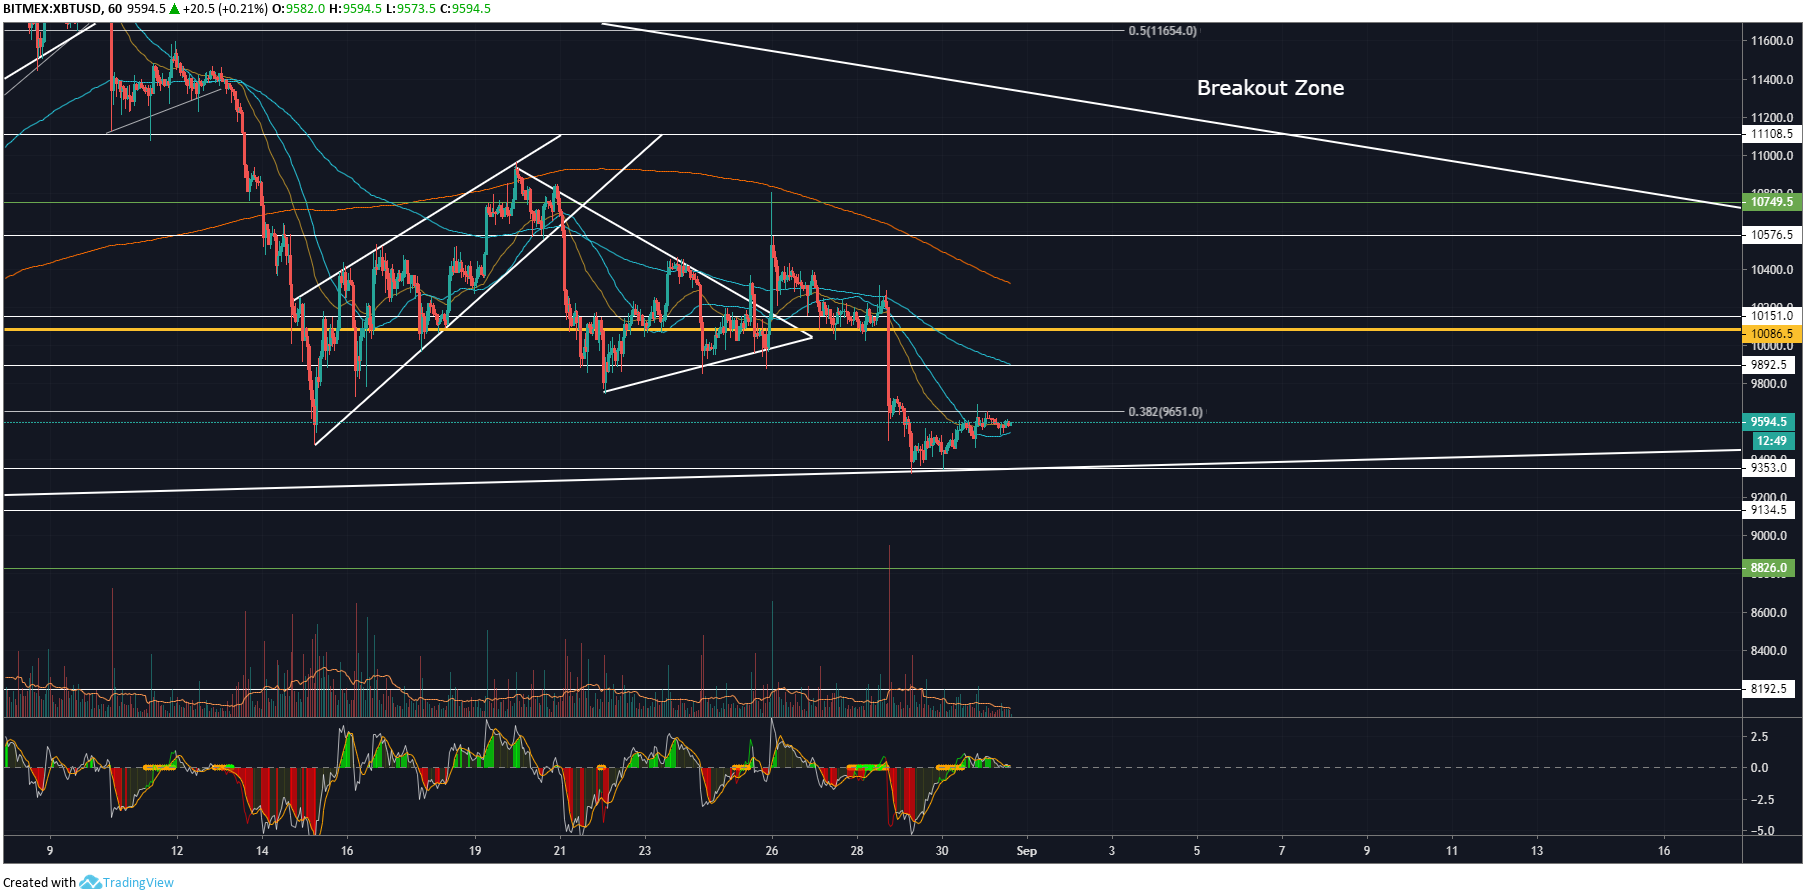
On the 1 hour chart for XBT/USD, we can see the decreasing volatility alongside low volume. There was a large bearish candle on the 29th of August that resulted in price levels dropping around $800, despite this no real momentum gathered up for the bears as price action now trades predominantly sideways around the 0.382 Fibonacci level around $9,500.
20 SMMA and 50 MA starting to visibly curl upwards around market price indicating a potential new bullish trend could form and take market price up to POC at $10,000. This is also the level in which the large bearish candle developed.
I expect price action to be quite boring over the next few weeks until either $9,400 is broken to the downside with clear sustainable bearish volume and not just one random large volume spike. Adversely, we would need to see the same increase in volume for the bulls taking price levels above $11,000 and clearly breaking up through the asymmetrical triangle mentioned.
Maxx momentum flashed a buy signal on the 30th of August (yesterday). This is a potential reversal sign alongside the 20 SMMA and 50 MA visibly curling up just above key support at $9,400.
Bitcoin Daily Analysis
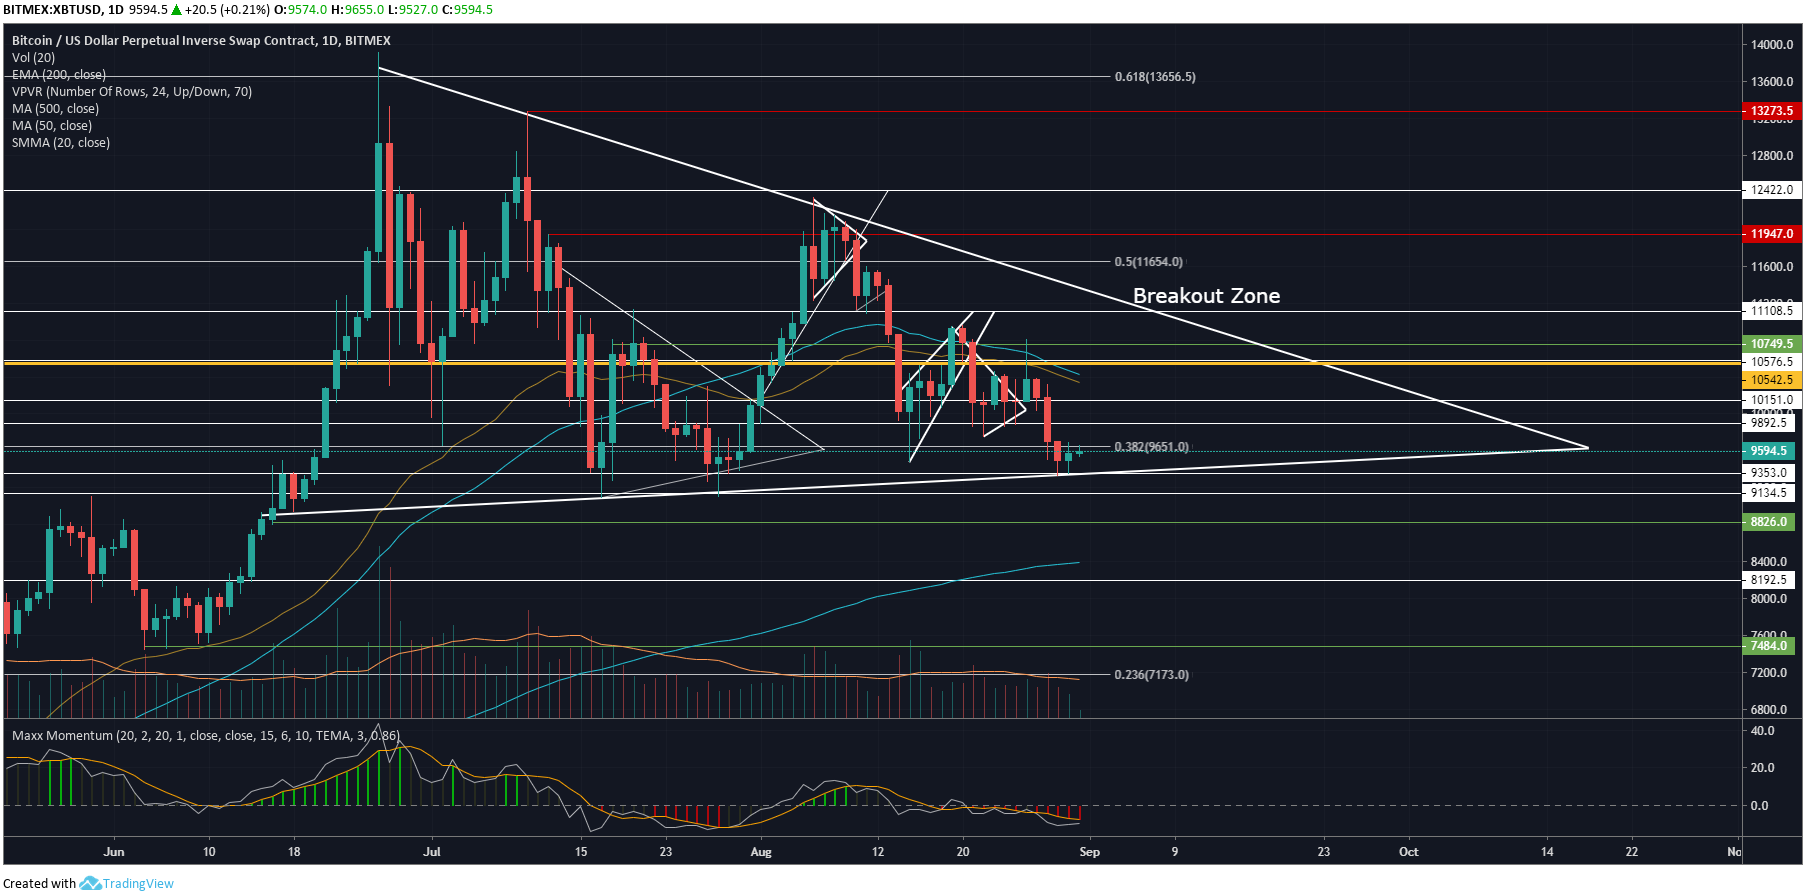
On the daily chart for XBT/USD, we can see the large asymmetrical triangle that has formed from the visible range highs at $14,000 to the lows at $9,100. POC (Point of Control) running directly through the middle indicates price action within the triangle formed is very much sideways consolidation despite the large range. This means there’s a large move ahead and this period of consolidation will act as the fuel behind the large move.
The trend is still very much bullish until price action breaks down through the triangle leading me to believe the large move will be to the upside. I will not be acting on any trades until the triangle has been broken, this allows me to trade with the market flow instead of trying to predict the market flow. Bitcoin could take until October to break out of this period of consolidation.
Maxx momentum currently sits just shy of the lowest point within the trading range visible on the daily chart. Maxx momentum will need to avoid dropping any lower otherwise momentum will very much favor the bears and likely result in Bitcoins price level breaking down through the asymmetrical triangle. Volume is a key factor to watch out for.
Do you think $9,300 will hold over the coming days? Please leave your thoughts in the comments below!
Images via Bitcoinist Image Library, BTC/USD charts by TradingView
This article is strictly for educational purposes and should not be construed as financial advice.
The post Bitcoin Price Analysis: $9,400 Key Support Holds For Now appeared first on Bitcoinist.com.