
The bitcoin price on Thursday depreciated as much as 10.33-percent against the US dollar.
The cryptocurrency reached an intraday low at $4,833 in an interim bearish correction. It was already trending inside an overbought zone when the downside action started. Traders found a decent opportunity to exit their long positions around bitcoin’s fresh yearly high at $5,342, prompting a sharp pullback towards $4,789, the higher-low from yesterday. The price didn’t extend the correction and started consolidating within a new trading range instead.
Bitcoin Price Consolidates Below $5,000
BITCOIN PRICE 1D CHART | SOURCE: TRADINGVIEW.COM, COINBASE
Coinbase data showed that bitcoin was more likely to extend its bearish correction to escape its overbought conditions. As of 20:21 UTC, the RSI was well above 70, signaling that buyers won’t be able to extend the bullish momentum any further. A red candle appeared thereafter, bringing RSI a little closer towards 70. A further selling action could, therefore, appear as the ongoing session matures.
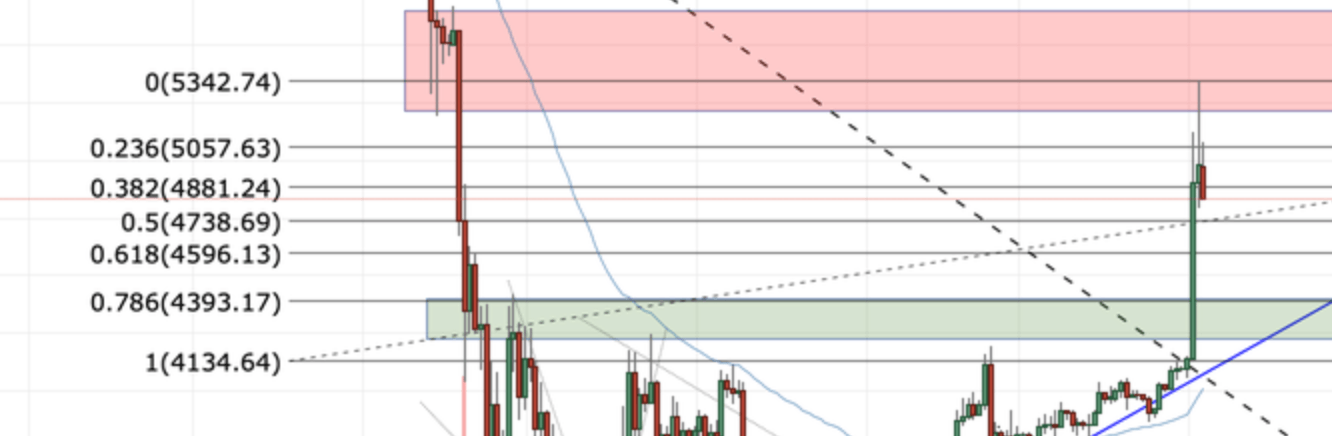
BITCOIN PRICE 1D CHART (ZOOM VERSION) | SOURCE: TRADINGVIEW.COM, COINBASE
An extended bearish correction could see bitcoin testing $4,738 – the 50% level of the Fibonacci retracement chart of the recent wave from 4134-low to 5342-high – as its next potential support. Nevertheless, it is the 78.6% level of the same wave that appears to be positioned ideally. The 4393-support was a critical resistance level from the November 29 trading session last year. Traders could consider it while opening new long orders.
We expect the bitcoin price to maintain its interim bullish bias as long as it stays above the ascending blue trendline. A break below it will push the price into a support zone, which was previously a critical resistance area. Bitcoin will resume its long-term downtrend only when it breaks below the green bar. Until then, it would keep its bullish momentum alive.
Bitcoin Price Could Test $6,000 if it Breaks Key Resistance Level
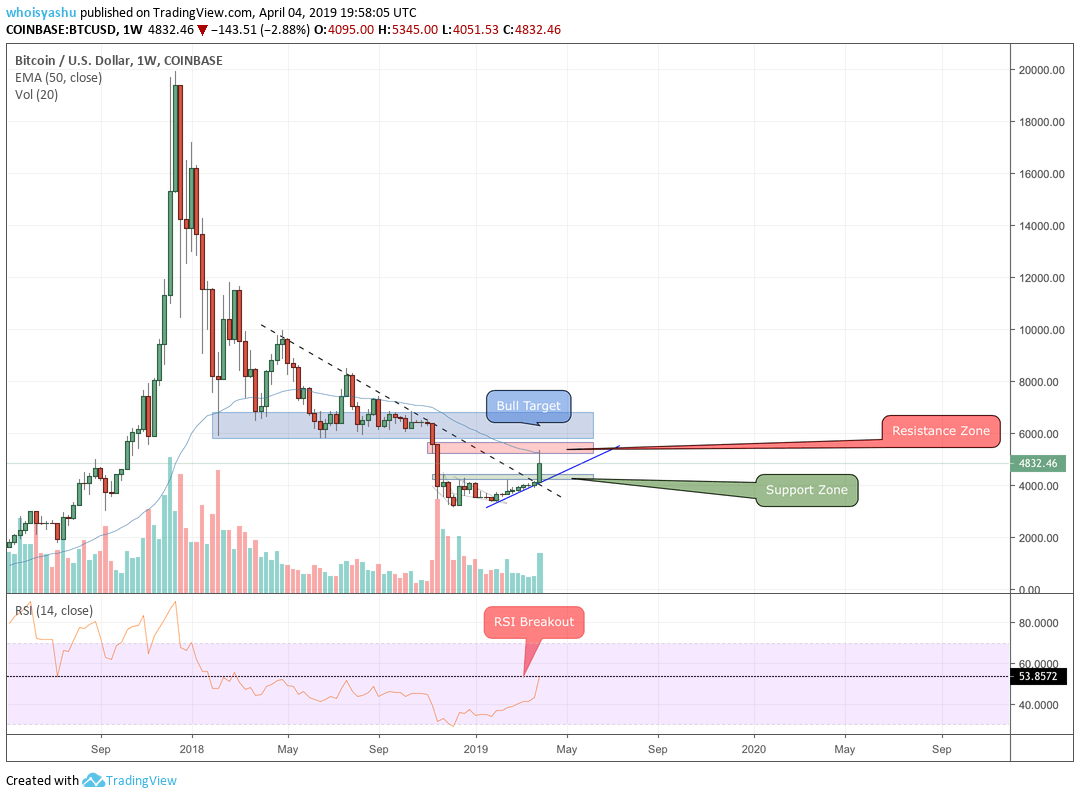
BITCOIN PRICE 1W CHART | SOURCE: TRADINGVIEW.COM, COINBASE
As discussed in our previous analysis, the bitcoin weekly chart was giving us two crucial resistance levels to watch.
First, it is the RSI level at 53.85 that so far has acted as a borderline between a long-term bearish and bullish bias.
Second, it is the 50-period EMA that is capping bitcoin’s weekly upside momentum from flourishing further. A break above the said moving average will coincide with a jump above 53.85.
If the price manages to stay afloat above those two resistances, the likelihood of it extending its rally towards $6,000 will increase considerably.