
At long last, Bitcoin has begun to move. In the past hour as of this article’s writing, the leading cryptocurrency has jumped up by $150 — BTC now trades at $9,320.
CHart of BTC's price action over the past two days from TradingView.com
While a move welcomed by bulls, it’s far from the explosive breakout that some were expecting. Case in point: volatility indicators, which barely notice 1-2% moves here and there, remain at multi-year lows. By some measures, in fact, volatility in the Bitcoin market is the lowest since 2017’s explosive rally.
Analysts remain certain that the explosive breakout is near, citing these volatility indicators.
Fortunately for bulls, there seems to be a growing case for Bitcoin to continue higher after its $150 rally on Tuesday morning.
Related Reading: Crypto Tidbits: Twitter’s “Bitcoin Scam,” Elon Musk & Dogecoin, Institutions Want BTC & ETH
Bitcoin Will See a “Monster” Breakout
According to a cryptocurrency trader, Bitcoin will see a “monster breakout” in the next three days as prices continue to tighten on a macro scale.
He shared the chart below along with his strong assertion. It shows that per the Bollinger Bands, a key technical indicator denoting volatility and key levels, BTC’s price action is extremely tight.
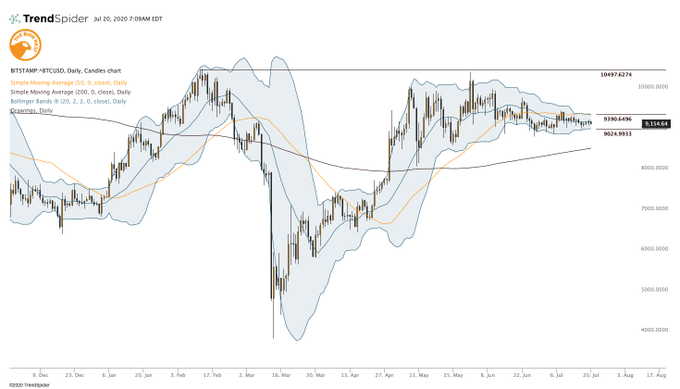
Chart shared by crypto trader "CryptoBirb" (@Crypto_Birb on Twitter) of BTC's recent price action and the Bollinger Bands.
Separate analyses of the Bollinger Bands indicator have found that they are at their tightest levels since November 2018. What followed the consolidation, of course, was a 50% drop over the span of two weeks that ended the bear market.
This suggests there will be an imminent move of macro proportions, likely to play out within the next week or two.
Bulls Are In Control?
Volatility indicators do not indicate which way the leading cryptocurrency will break. But with this latest news and new analyses, a growing number of traders are betting on the case for upside.
KI Young Ju, the chief executive of cryptocurrency analytics firm CryptoQuant, shared the charts below on July 20th. Attached, he wrote that there are three on-chain indicators signaling investors to “BUY.” These indicators are as follows:
- Addresses linked to Bitcoin miners are not sending their coins to exchanges, suggesting they are not being sold.
- Large BTC holders deemed “whales” remain HODLing their coin.
- The reserve of BTC on exchanges “hit the year-low a month ago and [it has kept] that low. This suggests there remains an accumulation mindset amongst a majority of cryptocurrency investors.
On-chain Indicators Status: BUY ?
– Miners are not selling (based on MPI, Miner Outflows)
– No significant #BTC exchange inflows from whales so far
– All exchanges’ reserve hit the year-low a month ago and keep that low pic.twitter.com/IzEmujvbsU— Ki Young Ju (@ki_young_ju) July 20, 2020
Further adding to the bull case forming, digital asset manager Charles Edwards noted last week that his flagship indicator just printed a macro buy signal. As reported by NewsBTC, he said on the matter:
“#Bitcoin Hash Ribbons “Buy” signal just confirmed. The post-Halving signal is particularly special. It will probably be a very long time until the next occurs. …and so the great bull run begins.”
This signal is important as it has preceded every one of Bitcoin’s parabolic rallies in the past decade.
Featured Image from Shutterstock
Price tags: xbtusd, btcusd, btcusdt
Charts from TradingView.com
Bitcoin Will See a "Monster Breakout" in the Next Three Days: Analyst