
As Bitcoin has shot higher in the past few hours, so too has Ethereum. The market leader tapping $10,000 was accompanied by ETH passing $275, reaching as high as $278 just minutes ago.
While this sudden jump higher, which comes after the altcoin flatlined around $270 for most of Sunday, has yet to be sustained, analysts are saying the cryptocurrency is cleared to register even greater games in the coming days for a confluence of reasons.
Ethereum Technical Outlook Is Extremely Bullish, Analysts Say
Earlier today, NewsBTC reported on an analysis of the one-week ETH chart by Teddy, a popular trader.
In the pertinent analysis, the commentator wrote that Ethereum’s weekly candle closing above $275 — a level which has acted as short-term resistance and support over the past two weeks or so — will make the asset “beyond bullish”:
“ETH: Weekly close above 275 beyond bullish. Anything below I see it as a rejection from a key resistance.”
#ETHEREUM | $ETH
Weekly close above 275 beyond bullish
__
Anything below I see it as a rejection from a key resistance.
Suggesting that it may revisit 225 area as a retest of previous resistance as support pic.twitter.com/RyT6XOcGRl
— TEDDY (₿) (@TeddyCleps) February 23, 2020
Just minutes ago, the asset closed above this level ($276, to be exact), marking a higher high. Teddy did not allude to what he expects for the cryptocurrency to do after it makes a close above this level, though other analysts are expecting more upside.
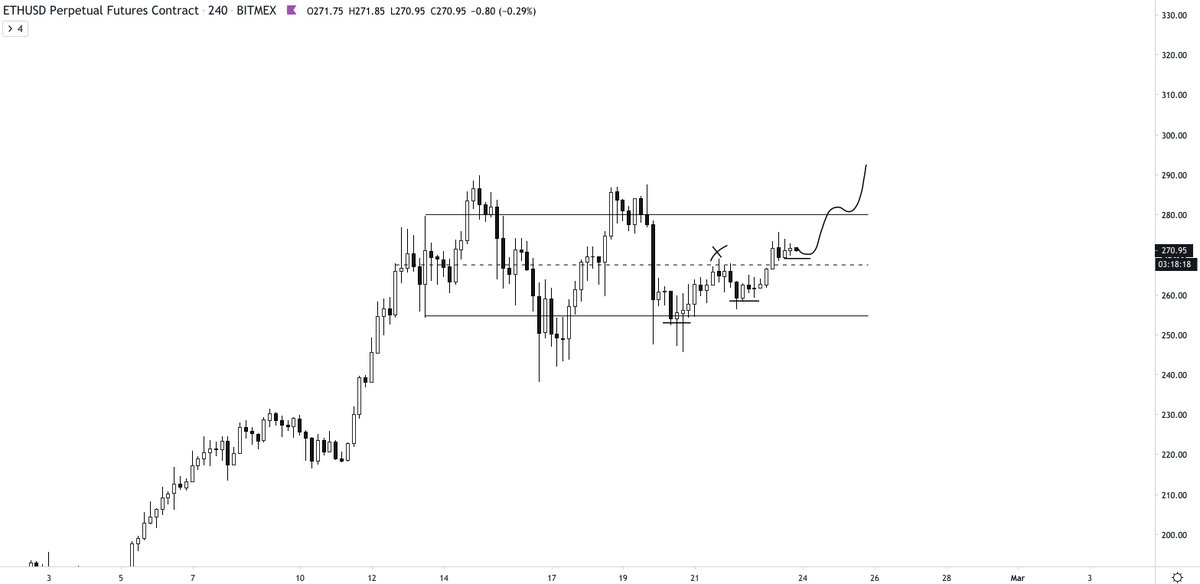
From an extremely short-term perspective, analyst Cactus published the below chart and an accompanying message. In that message, the trader wrote that a weekly close above $267 is extremely positive, adding that such a close is likely to send Ethereum towards $290 in the coming days.
Indeed, RookieXBT recently remarked that Ethereum’s six-hour chart is showing a number of positive signs:
- ETH is currently printing an “ascending triangle structure,” marked by a number of tests of a horizontal resistance level and slowly-trending-higher prices. Ascending triangles most often break upwards.
- The six-hour Relative Strength Index (RSI), a measure of the magnitude of price action, is creating a falling wedge structure. Falling wedges normally break upward.
- There are hidden bullish divergences forming between the price of Bitcoin, which has been registering a series of higher lows, and the RSI, which continues to make lower lows. This suggests a breakout of the RSI wedge may come shortly, which should send Ethereum above the triangle that has constricted upward price action.
Featured Image from Shutterstock