Bitcoin (“BTC”) is regularly called “digital gold,” due in part to its characteristic of having limited supply that must be mined, requiring the expenditure of significant energy, which in turn might makes it a credible store of value (see my other post), also just like gold. There may be further potential similarities of BTC to gold to investigate. No, I am not talking about the potential of using Bitcoin as jewelry – I do not see public key QR code necklace pendants or the like catching on. The hypothesis this article will begin to investigate is whether BTC might be a ‘save haven’ asset, that, like gold, could provide refuge in times of market turmoil.
For simplicity’s sake, let us define “market turmoil” here as significant dislocations, to the downside, in the equity market.
The two potential sides of the argument
Before looking at any historical evidence, let us review, in an abbreviated way, what arguments could be made for and against the hypothesis of BTC being a safe haven asset.
“Yes, it is!”
- BTC, due to the supply limit built into its protocol, is a deflationary asset with, in theory, no or limited correlation with other asset classes.
- That should make it an attractive investment option in a ‘risk-off’ scenario.
- If a market sell-off happens that is wholly or partly fueled by fear over fiat currencies, this should further increase the attraction of BTC.
- Anecdotally, many BTC holders are idealists who believe in BTC in the long term and would not sell it in a draw-down scenario.
“No, it is not”
- Anecdotally, large holders of BTC are often e.g. family offices and other types of investors who invest across asset classes.
- In a severe downward move, e.g. in the equity markets, these holders, many probably already sitting on significant BTC profits, will likely sell BTC, either in a forced way (i.e. contagion) or voluntarily in order to reallocate to attractive post-correction equity opportunities (as, at least for now, one still needs fiat currency to invest in the equity markets…)
Note that a reference to the nature of BTC’s holders popped up on both sides of the argument, and in both cases backed only by anecdotal evidence. Clearly, it would be desirable to have better data about BTC’s holders in order to judge how ‘loose’ or ‘solid’ those holdings are. However, the anonymity built into the BTC blockchain, often touted as one of its core attractions, makes any detailed holdings analysis impossible. In fact, we cannot even really tell how concentrated holdings are as it is common practice, partly due to security reasons, to break up holdings among several addresses.
There are no regulatory reporting requirements for BTC either. Any holdings structure judgment that we commonly make for stocks, e.g. along the lines of “this stock is a core holding for pension funds” or “this stock is a hedge fund hotel” is simply not possible with BTC.
The limited historical evidence
As we do not seem to get very far with the theoretical analysis, let us look at the limited historical data to evaluate whether BTC may be a safe haven in times of market turmoil. As noted above, let us focus on turmoil in the equity market and let us, for now, focus on the U.S. equity market, using the S&P 500 as a proxy for market performance. In the future, it would be desirable to run the same type of analysis for other markets – specifically large Asian markets like Hong Kong, Japan or Korea, given BTC’s popularity in that region.
Note that we use data starting from April 2014 – partly due to the availability of reliable data and partly due to the fact that, arguably, BTC simply was not ‘mainstream’ enough prior to that time frame (roughly speaking – no exact science here). We will look at BTC vs. the S&P 500 return first on a daily and then on a weekly basis. We will also always use gold as a comparison, as it arguably is the gold standard (pun intended) of a safe haven asset.
BTC vs. the S&P 500 – DAILY returns
- The below scatter plot shows BTC percentage returns (y-axis) vs. the S&P 500 percentage returns (x-axis).
- Blue dots represent downward moves in the S&P 500 of over 3 standard deviations.
- Green dots represent downward moves in the S&P 500 of over 2 standard deviations but less than 3 standard deviations.
- There are 19 days with the S&P 500 downward moves greater than two standard deviations, and 8 days with greater than 3 standard deviations (unfortunately, not a lot of data points).
- Note that standard deviations are rolling 1-year, which is why blue and green dots actually may be interspersed (as market volatility changes over time).
- The diagonal grey line is not a regression best-fit line (more on that below) but rather simply a line with slope 1, i.e. for any point above, BTC had a better return than the S&P 500 on the given day, and vice-versa.
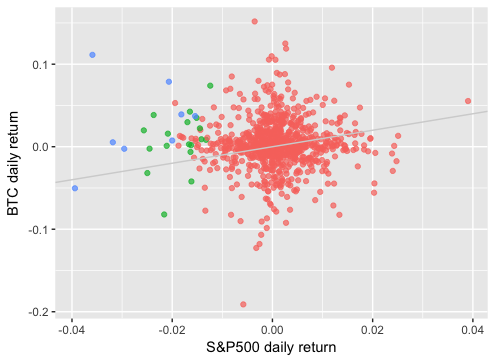
- Purely visually, for the majority of significant downward moves in the S&P 500, BTC had a better return on the day than the S&P 500.
- It is also pretty clear visually that BTC and the S&P 500 returns are not very correlated at all and, indeed, a simple regression shows an r-squared of virtually zero (unsurprisingly, the intercept term, is favorable to the tune of some 0.3% per day in BTC’s favor).
Now let us compare this analysis with gold.
Gold (spot) vs. S&P 500 – DAILY returns
(All the same comments/assumptions as above apply)
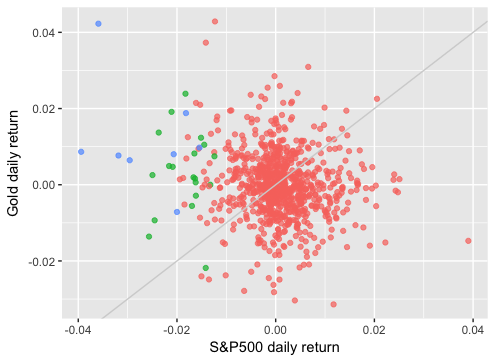
- Purely visually, even more of gold’s returns on days of significant S&P 500 downward moves are outperforming the S&P 500 on the given day.
- As expected, the correlation of Gold and the S&P 500 is also virtually zero (and, here, the intercept is also virtually zero). It would be useful to also look at the correlation of BTC and gold over time and we shall come back to this at the end of the article.
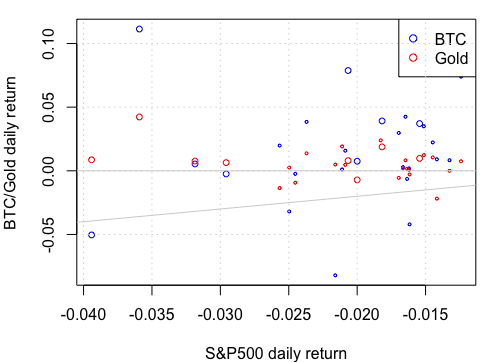
Both BTC and Gold on significant S&P 500 down days
Here we are zooming in just on days where the S&P 500 had a significant downward move, and looking at gold (red) and BTC (blue) in the same chart.
A statistical test
Eyeing charts is all good, but not very statistically rigorous. Let us therefore also run statistical analyses that compare the performance of both BTC and Gold on days with significant downward moves in the S&P 500 with their performance on ‘normal’ days. We do this using a Welch t-test.
- For both BTC and gold, their mean return on S&P 500 down days is above their mean return on other days.
- This outperformance is statistically much more significant for gold (p-value of 0.02) than for BTC (p-value of 0.17).
BTC vs. S&P 500 – WEEKLY returns
Let us repeat the same sort of analysis for weekly returns as, absent ‘real crashes’, market corrections tend to occur not in one, but over several days, so we should look at returns over a longer time frame, too.
Rather than going through all the same graphs, let us jump to a graph that plots BTC and Gold weekly returns vs. S&P 500 weekly returns. The biggest dots are >3 standard deviations S&P 500 drops, intermediate dots are between 2 and 3 standard deviations, and small dots are smaller than 2 standard deviations.
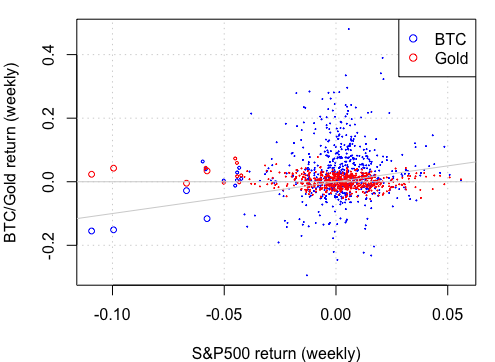
One effect of going from daily to weekly returns is that, unfortunately, we end up with even fewer data points – 4 events where the S&P 500 weekly drop exceeds 3 standard deviations, and 8 where it is between 2 and 3 standard deviations. Furthermore, since we are looking at rolling weekly returns, some of these data points actually reflect the same event/news flow.
Let us therefore zoom in onto the events. The graph below groups the event data points by event, using a different graphical marker for each event. The legend shows the first date of the event.
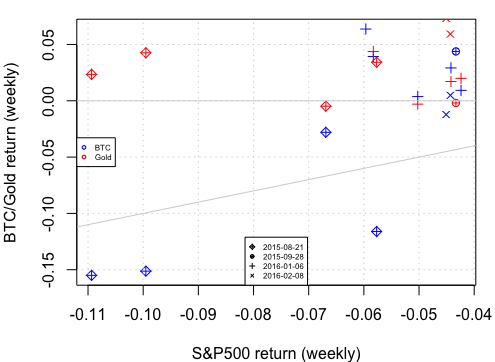
Gold outperformed BTC in the majority of S&P 500 drawdowns, albeit BTC held up well during the Jan-16 sell-off.
By the way, the t-test analysis we ran above does not make sense here anymore due to the small number of ‘event’ data points.
So, what is the right time frame to look at?
That all depends. First, not, of course, that we could have chosen further timeframes, e.g. going really short term and looking at intra-day reactions of BTC, gold (and the S&P 500 or another relevant index) as material news come out. Let us look at the price action for BTC, Gold and indices around two relatively recent news events.
The election of Donald Trump during the night of 08/09-Nov-16
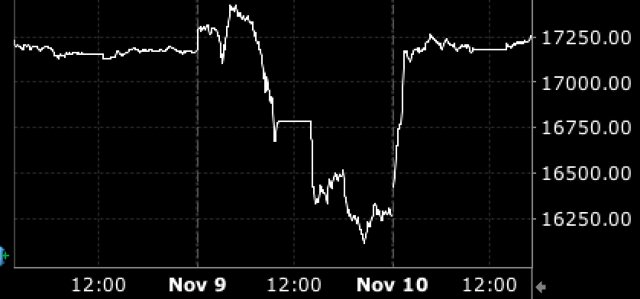
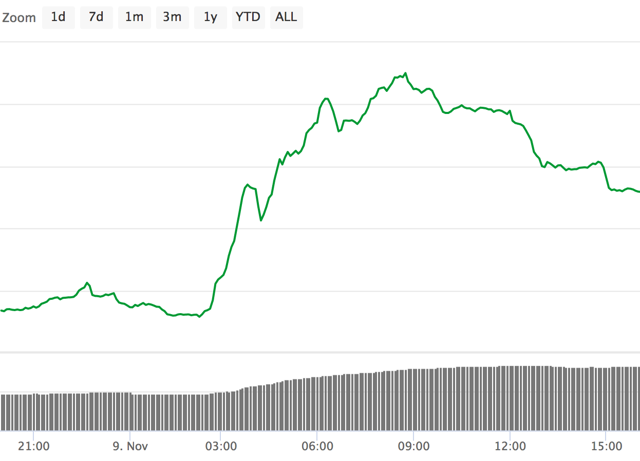
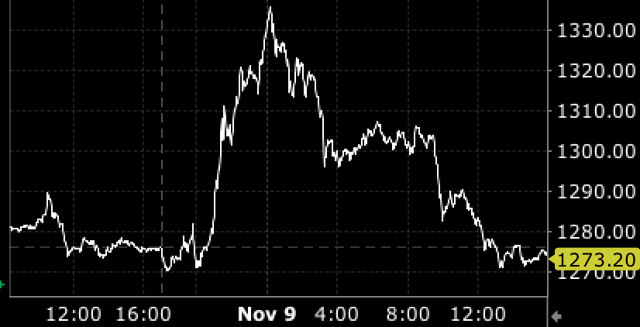
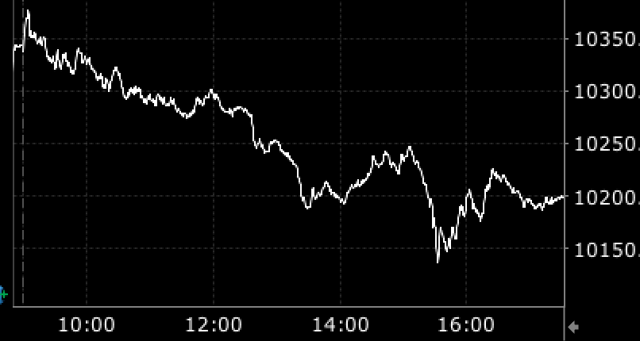
As the U.S. market was closed, we look at Japan’s Nikkei index (first chart). The second and third charts show BTC and gold prices, respectively, during the same event. One can see that both BTC and gold reacted as the news unfolded.
Nikkei index during Trump election night
 BTC during Trump election night
 Gold during Trump election night
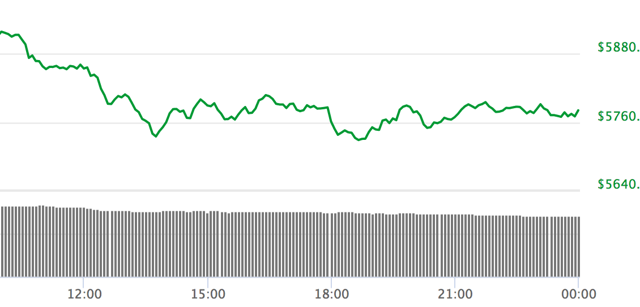
The Catalan independence declaration during the day of 27-Oct-17
Here we look at the Spanish IBEX index (first chart), again followed by BTC (second chart) and gold (third chart).
IBEX during Catalan independence declaration
 BTC during Catalan independence declaration
 Gold during Catalan independence declaration
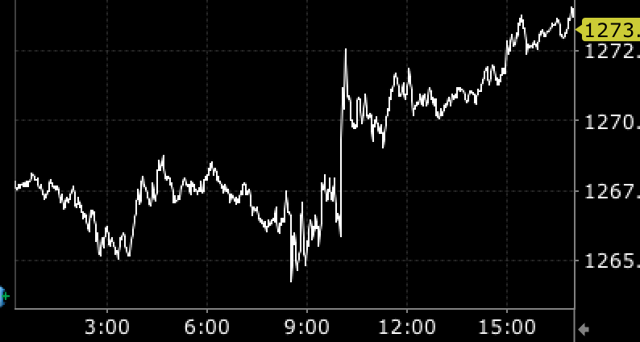 This time, while gold reacted, BTC did not. Why is that? I have no idea. At best, perhaps the Catalonia crisis was not a big enough event to pique the interest of BTC traders. At worst, it may be that BTC price action is currently too overshadowed by BTC’s upcoming hard fork.
It is important to note that neither of the two events cited above did actually cause a major market drawdown in the end. One could therefore argue that any initial reaction of BTC (or gold for that sake) just reflected the beliefs that those traders who were acting at the time have regarding the role of BTC as a safe haven (or not), i.e. a self-fulfilling prophecy, whereas we simply do not know how flows would have impacted BTC if the market dislocation would have continued for longer and become a statistically meaningful one over the longer time frame. Contagion, for example, is arguably a factor that takes a significant dislocation and time in order to develop.
Also, if you want to protect (or even increase) your capital in the event of a market drawdown, you need your safe haven to either ‘go your way’ (i.e. increase in value or at least remain stable) for the entire duration of the market dislocation or at least long enough so that there is sufficient liquidity for you to take advantage of the initial advantageous safe haven move and then reallocate into something else.
For those reasons, I prefer to look over the longer-term (e.g. weekly as above) behavior of the safe haven asset candidates during market drawdowns rather than the very short-term reactions.
Rolling correlation between BTC and gold
I was owing this analysis – here goes: the rolling 3-month correlation between BTC and gold returns.
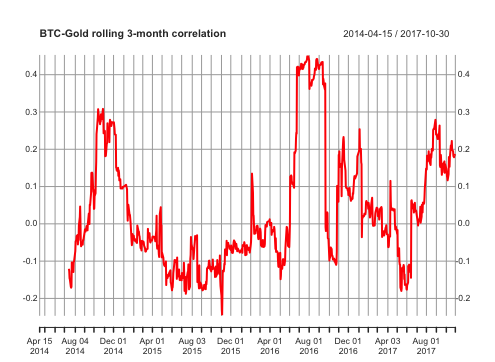
As you probably guessed, if one looks over the entire time frame, the r-square is virtually zero.
Conclusion (?)
I do not find the data very conclusive either way. The key data point we are missing is a true market dislocation (think 1987, 2000, or 2008) and its impact on BTC (which was not around yet at those times). However, while this means that there is probably not enough data to conclude that BTC is not a safe haven asset, it, of course, also means that there is not enough data to conclude that it is. When push comes to shove, I will most likely continue to use things like gold and certain major fiat currencies as safe havens (and out-of-the money options as further tail protection, especially in these times of historically low volatility).
I also find the point that I alluded to in the context of the Catalan crisis important: perhaps BTC did not react as its price action is currently too overshadowed by the upcoming hard fork. The general point being that BTC can, and does, have idiosyncratic news flow (e.g. hard forks) impacting price to an extent that is difficult to see for e.g. gold – what happens if that idiosyncratic news flow happens exactly at a time when you are relying on BTC to act like a safe haven asset? Finally, this analysis does not impact my view as BTC as a store-of-value diversification asset as analyzed in this post.
How about you? If you were certain a market sell-off was about to happen and hence reallocating some of your assets into safe havens, would you put any into BTC? If so, what proportion?
Disclosure: I/we have no positions in any stocks mentioned, and no plans to initiate any positions within the next 72 hours.
I wrote this article myself, and it expresses my own opinions. I am not receiving compensation for it (other than from Seeking Alpha). I have no business relationship with any company whose stock is mentioned in this article.
Additional disclosure: I am long Bitcoin.